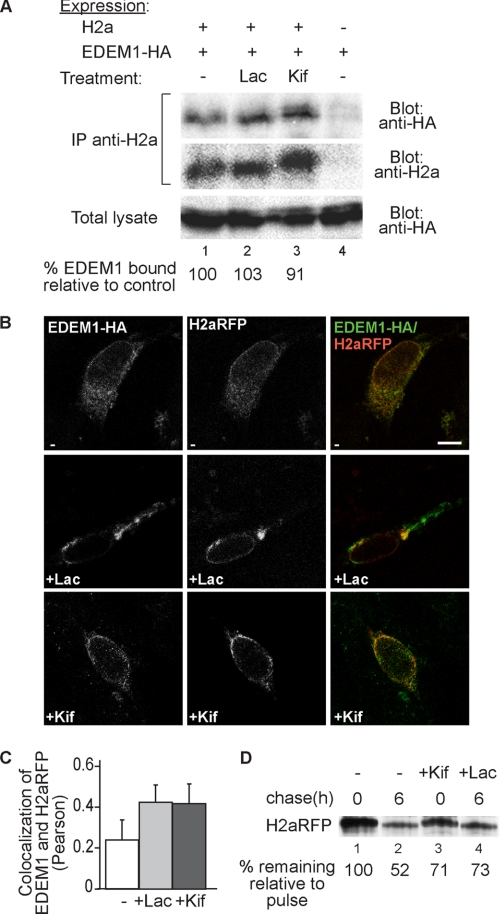
FIGURE 2.
Inhibition of mannose trimming does not preclude EDEM1 interaction with H2a nor their subcellular colocalization. A, HEK 293 cells were cotransfected with a vector encoding for HA-tagged EDEM1 (EDEM1-HA) with or without an H2a encoding vector. Two days after transfection, the cells were incubated for 3 h in the absence/presence of 25 μm Lac or 100 μm Kif. The cells were lysed in 1% Nonidet P-40, 50 mm Tris/HCl (pH 8), 150 mm NaCl, and 10% of the lysates were run on 10% SDS-PAGE and immunoblotted with anti-HA antibodies (bottom panel). The rest of the lysates were immunoprecipitated (IP) with anti-H2a and protein A-Sepharose. Eluted samples were subjected to 10% SDS-PAGE and immunobloted with anti-HA (upper panel) or anti-H2a (middle panel). H2a (35-kDa fragment) (see Fig. 1) appeared as a very weak band in immunoblots and is therefore not shown. Quantitations of the relative amounts of EDEM1 associated with H2a are shown at the bottom as percent of EDEM1-HA coprecipitated with H2a relative to the mock transfection. The results are normalized by dividing the intensity of the EDEM1 band in the upper panel by that of its corresponding band in the lower panel and by that of H2a in the middle panel. B, NIH 3T3 cells were transiently cotransfected with H2aRFP together with HA-tagged EDEM1. 24 h after transfection, cells were incubated for 3 h in the absence (upper panels) or presence of 25 μm Lac (middle panels) or 100 μm Kif (lower panels), fixed, permeabilized, and incubated with mouse anti-HA followed by probing with FITC conjugated goat-anti mouse IgG. The samples were analyzed in an LSM confocal microscope. Representative optical slices are shown. Colocalization of FITC with RFP appears yellow. Bar, 10 μm. C, the graph shows colocalization analysis (Pearson) performed using the ImageJ program (average of 30 cells from three independent experiments are presented; error bars are S.D.); p < 0.045 for treated samples compared with untreated. D, similar to the pulse-chase experiment in Fig. 1A but performed with cells transiently transfected with an H2aRFP cDNA-encoding vector in the absence or in the presence of Kif (100 μm) or Lac (25 μm).

