
FIGURE 4.
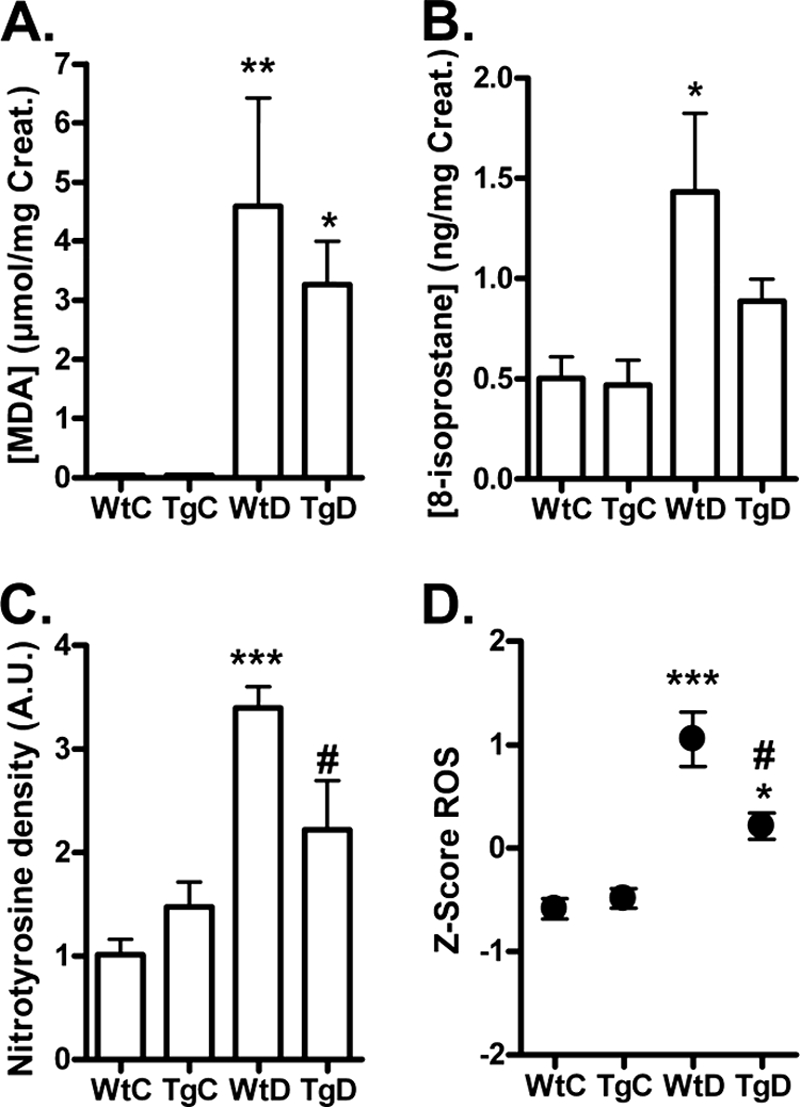
Formation of ROS markers in urine and tissue from wild-type and transgenic GLO-I rats. MDA (A), 8-isoprostane (B), and kidney nitrotyrosine (C) levels in WtC, TgC, WtD, and TgD rats were measured with HPLC and Western blotting, and a composite score was calculated for the three ROS markers (D). * p < 0.05 compared with control; **, p < 0.01 compared with control; ***, p < 0.001 compared with control; # p < 0.05 compared with wild-type diabetic. A.U., absorbance units. Creat, creatinine.