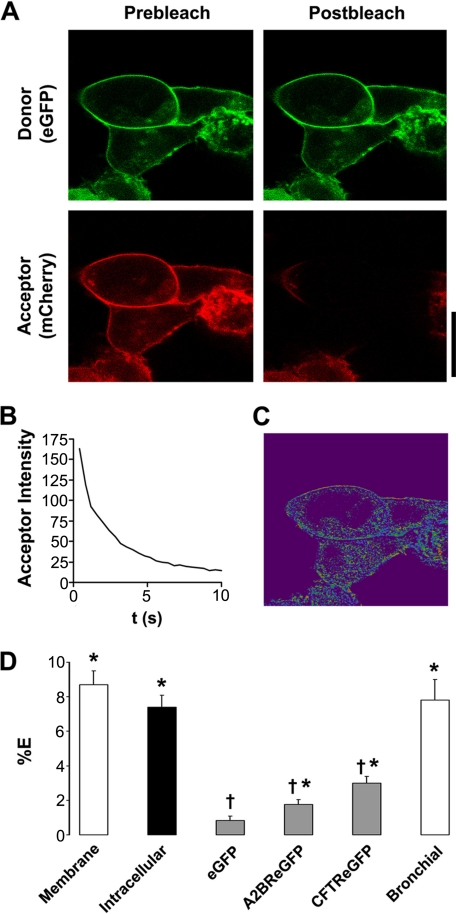
FIGURE 3.
Ano1-eGFP and Ano1-mCherry undergo specific FRET in the plasma membrane. A, typical confocal micrographs of Ano1-eGFP (green, donor) and Ano1-mCherry (red, acceptor) before and after photobleaching of Ano1-mCherry. B, graph showing typical acceptor photobleaching over 10 s. C, resultant FRET image calculated from A. D, mean FRET efficiency (%E). Open bars, plasma membrane FRET in HEK293 cells (n = 56) and human bronchial epithelial cells (n = 13). Closed bar, intracellular FRET in HEK293 cells (n = 36). Gray bars, FRET between Ano1-mCherry and the denoted acceptor molecule. eGFP, Ano1-mCherry (n = 19); A2BR-eGFP, Ano1-mCherry (n = 19); CFTR-eGFP, Ano1-mCherry (n = 22). * denotes FRET that is p < 0.05 different from 0. † denotes FRET that is p < 0.05 different from plasma membrane Ano1 FRET in HEK293 cells. Scale bar represents 25 μm.

