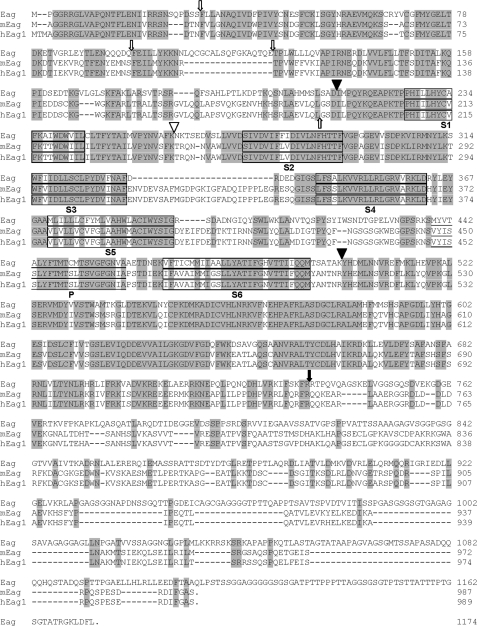
FIGURE 4.
Comparison of amino acid sequences of Eag, mEag, and hEag1. Identical residues in the three channel proteins are shown in shaded boxes and predicted membrane-spanning regions are outlined. Filled triangles denote the positions of chimeric channel constructions and full C-terminal deletions. The sites of distal C-terminal truncation and internal Myc tag insertion are indicated with a filled arrow and open triangle, respectively. N-terminal truncations are indicated with up or down open arrows for mouse and fly channels, respectively.

