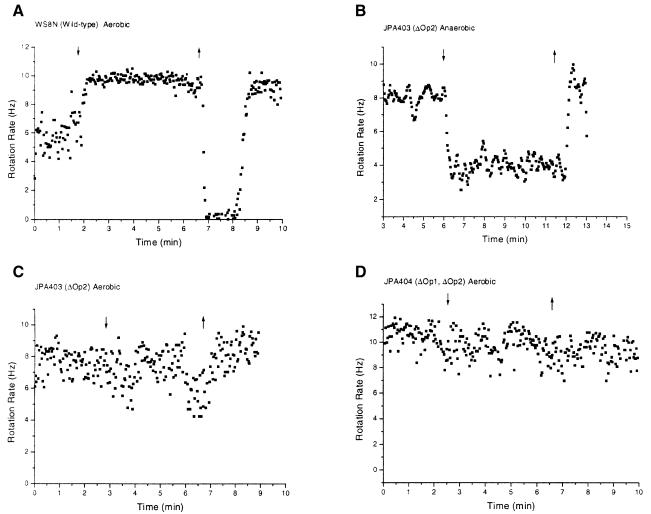
Fig. 2. Behaviour of tethered cells. The strains and conditions are indicated above each graph. Mutated operons/genes are indicated in parentheses. ΔOp1, deletion of che operon 1; ΔOp2, deletion of che operon 2. Down arrow, addition of 1 mM propionate; up arrow, removal of propionate. Other details in text.

An official website of the United States government
Here's how you know
Official websites use .gov
A
.gov website belongs to an official
government organization in the United States.
Secure .gov websites use HTTPS
A lock (
) or https:// means you've safely
connected to the .gov website. Share sensitive
information only on official, secure websites.
