FIGURE 5.
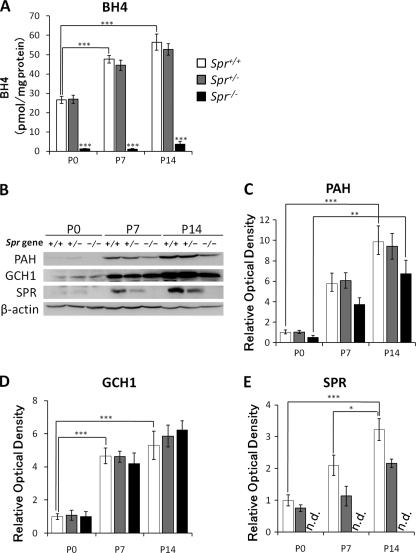
Alternation of BH4 content and protein levels of PAH, GCH1, and SPR in the liver of Spr mutant mice in the early postnatal period. A, BH4 content in the liver was measured at P0, P7, and P14. B, 50 μg of protein in the liver homogenate were separated by 10% SDS-PAGE and immunoblotted with specific antibodies against PAH, GCH1, SPR, and β-actin. C–E, shown is a summary quantification of Western blot signals of PAH (C), GCH1 (D), and SPR (E). Quantified values of immunoblot signals were first normalized to β-actin immunoreactivity, and relative ratios to the mean value in P0 Spr+/+ mice are shown. Data represent the mean ± S.E. n = 4 mice for all groups. *, p < 0.05; **, p < 0.01; ***, p < 0.001, one-way ANOVA followed by Tukey's multiple comparison test. Stars over bars indicate differences between Spr+/+ and Spr−/− mice within the same age, and stars above lines indicate differences between Spr+/+ mice of different ages.

