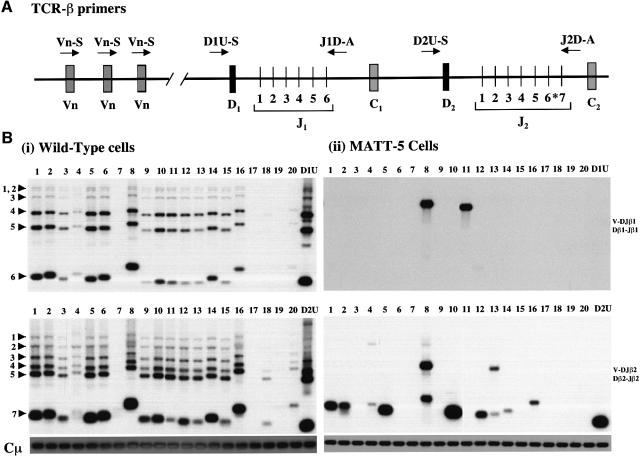
Fig. 4. Analysis of TCR-β chain rearrangements in CD45–/–LckF505 tumour cells. (A) Schematic representation of the murine TCR-β locus (based on Gärtner et al., 1999). Variable (V), diversity (D), joining (J) and constant region (C) segments are shown. Primers are indicated by arrows. The upstream primers are located either within (Vβ1–20) or immediately 5′ (D1U-S, D2U-S) of their target sequences. The downstream primers (J1D-A, J2D-A) are situated just 3′ of JB1.6 and JB2.7, respectively. The J-region Jβ2.6 marked with an asterisk is a pseudogene. (B) PCR analysis of D–J and V–DJ recombination in (i) wild-type C57BL/6 thymic DNA; (ii) MATT-5 tumour cell-line DNA. The rearrangement of Vβ and Dβ gene segments into the Jβ1 (upper panels) and Jβ2 (lower panels) regions was analysed using the PCR primers shown in (A). For each sample, the upstream primer used is shown at the top of the relevant track. For the downstream primers, J1D-A was used in both upper panels and J2D-A was used for both lower panels. Lanes D1U and D2U indicate Dβ1–Jβ1 and Dβ2–Jβ2 joining events, respectively. Lanes 1–20 indicate usage of Vβ1–20. Product specificity was confirmed by hybridization with oligonucleotide probes corresponding to Jβ1.6 and Jβ2.7 gene segments for the upper and lower panels, respectively (Gärtner et al., 1999). The bands marked by arrowheads represent rearrangements of Vβ genes to DJβ1 (upper panels) or DJβ2 (lower panels). Sequences from the Cµ gene were amplified as a loading control (lowest panels). Note that Vβ17 is a pseudogene in C57BL/6 mice. Prolonged exposure of gels revealed faint bands in the Vβ7 and Vβ19 lanes (lanes 7 and 19).

An official website of the United States government
Here's how you know
Official websites use .gov
A
.gov website belongs to an official
government organization in the United States.
Secure .gov websites use HTTPS
A lock (
) or https:// means you've safely
connected to the .gov website. Share sensitive
information only on official, secure websites.
