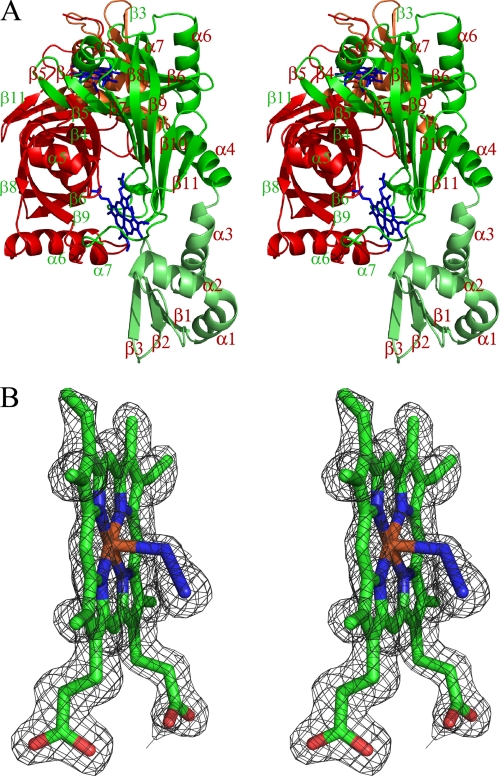
FIGURE 1.
A, stereoview of the HugZ dimer. The two monomers are displayed in red and green, respectively. The N domains are in darker colors. The heme and azide moieties are shown as stick models. The dimer is viewed along the barrel of the red monomer whereas the barrel of the green monomer is on the plane. B, stereoview of the σA-weighted 2 Fo − F c omit map around one of the bound hemin and azide moieties, contoured at 1.5σ. The map is superimposed on the final model of the ligands.

