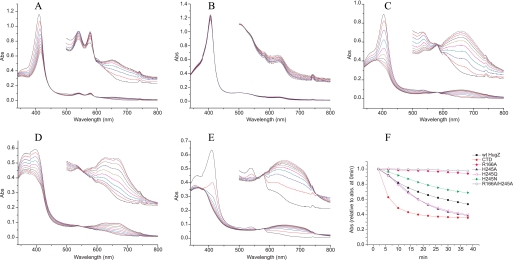
FIGURE 3.
A–E, enzymatic activity assays of wild-type HugZ (A), R166A mutant (B), H245A mutant (C), H245N mutant (D), and the C-terminal domain truncate mutant of HugZ (CTD) (E). The spectra were recorded at an interval of 4 min for 40 min over the wavelength range 340–800 nm. The spectra between 500 nm and 800 nm are magnified ×5 in insets. F, enzymatic activities of HugZ and its mutants, measured by the change of maximum absorptions over time relative to their respective maximum absorptions at 0 min.

