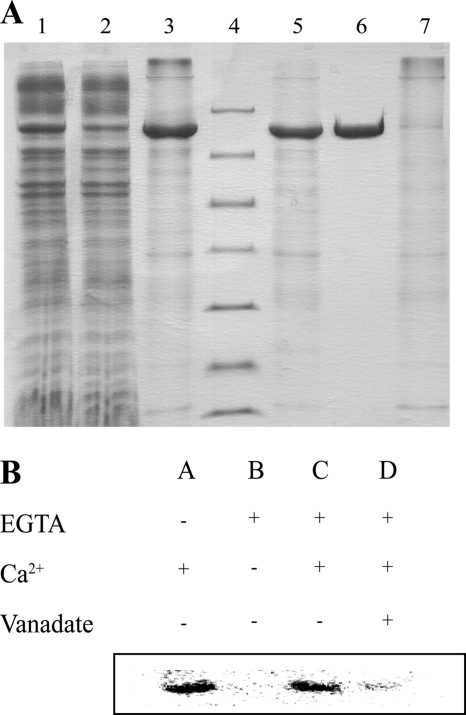
FIGURE 1.
A, purification of LMCA1. 1–3, first Ni2+ column 1:DDM-solubilized mixed membranes; 2, flow-through; 3, imidazole-eluted LMCA1; 4, marker (116.0, 66.2, 45.0, 35.0, 25.0, 18.4, and 14.4 kDa), 5–7, second Ni2+ column; 5, TEV protease-digested and dialyzed LMCA1. 6, flow-through; 7, imidazole elution; B, phosphorylation of LMCA1. The reaction was started by the addition of [γ- 32P]ATP and Ca2+ resulting in a band corresponding to LMCA1 (A). The addition of EGTA, removing Ca2+, abolished the phosphorylation (B), but the phosphorylation could be restored by adding back Ca2+ (C). The phosphorylation could be inhibited by the addition of vanadate (D).

