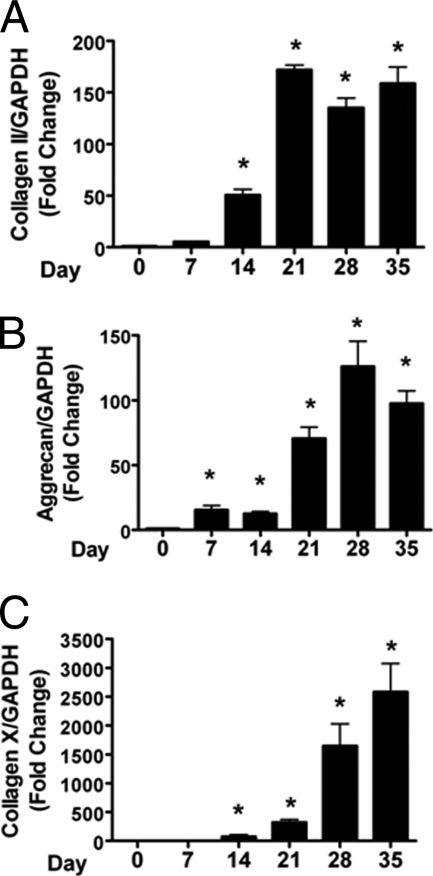
FIGURE 4.
Quantitative real-time PCR analyses of (A) type II collagen, (B) aggrecan, and (C) type X collagen in differentiating ATDC5 cells. RNA was extracted at different time points. The mRNA expression relative to GAPDH was determined, and the fold changes were calculated relative to day 0. (*, p < 0.05; ANOVA; n = 3).

