
Figure 2.
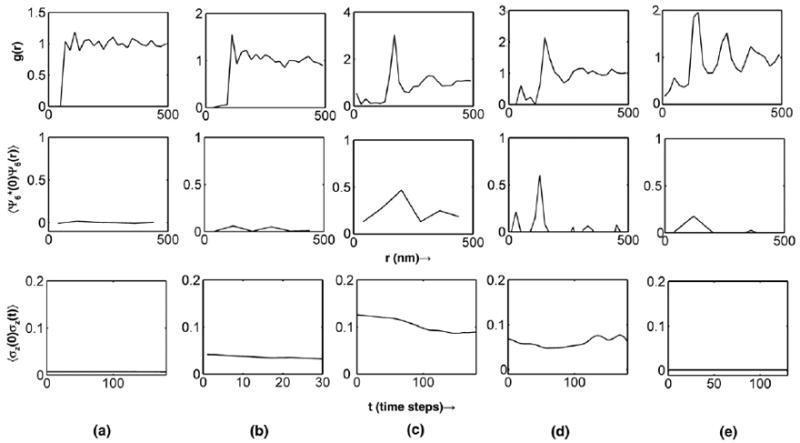
(Top row): Radial distribution functions showing liquid-like order with the packing determined by the range R. (Middle row): Orientational correlation functions up to 4R. (Bottom row): Height correlation functions showing the relaxation time associated with the dominant membrane undulation mode. (a) ρ* = 0.03, R/nm = 40, C0 × μm = 15; (b) ρ* = 0.008, R/nm = 60, C0 × μm = 60; (c) ρ* = 0.016, R/nm = 100, C0 × μm = 20; (d) ρ* = 0.012, R/nm = 80, C0 × μm = 30; (e) ρ* = 0.03, R/nm = 80, C0 × μm = 5.