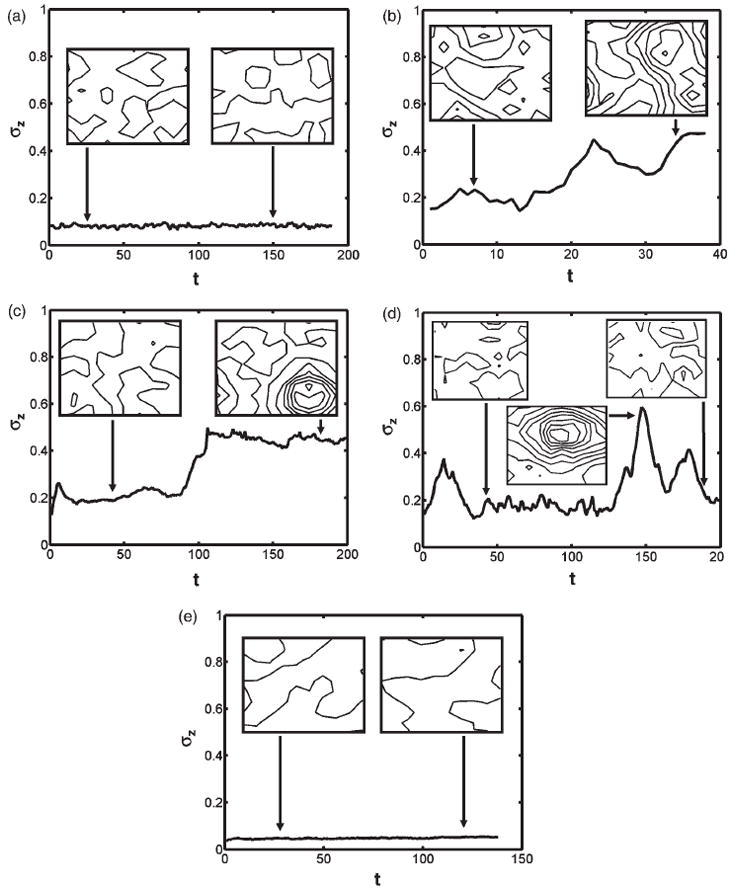
Figure 3.

Standard deviation of the height profile as a function of simulation time, t. (a)–(e) correspond to cases (a)–(e) of Figure 2. Insets in each panel depict the contours of the membrane height profile (as well as a snapshot of the membrane profile) at the indicated simulation time. Adjacent contour lines have a height difference of 0.5 Å.
