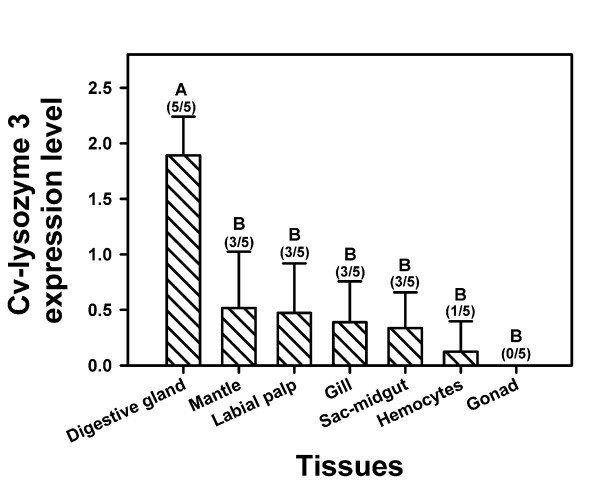
Figure 4.
Tissue-specificity of cv-lysozyme 3 gene expression determined using semi-quantitative RT-PCR. Expression levels of cv-lysozyme 3 mRNA (based on comparison between the cv-lysozyme 3 amplicons generated in 35 PCR cycles and the 28 S rRNA amplicons generated in 25 PCR cycles for sample normalization) are indicated for each tissue tested. Mean ± standard deviation (SD) are shown for each tissue, with fractions indicating the proportion of the 5 oysters assayed in which cv-lysozyme 3 mRNA was detected. Columns with the same letter are not significantly different in expression level (P < 0.05).

