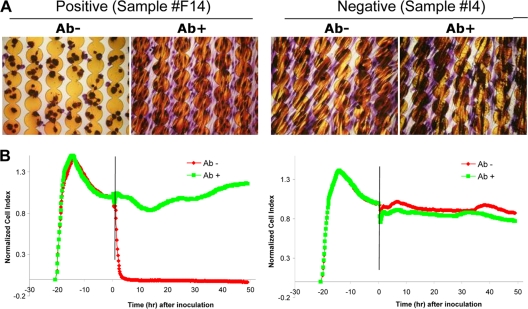
FIG. 2.
Representative C. difficile toxin RTCA results in clinical samples. (A) Stained microscopic images of cells which were grown on the E-Plate. (B) Kinetic curves with vertical lines indicating the time point that the tested specimen was added. The samples incubated either with the neutralizing antibody (green, Ab+) or without the neutralizing antibody (red, Ab−) are indicated.

