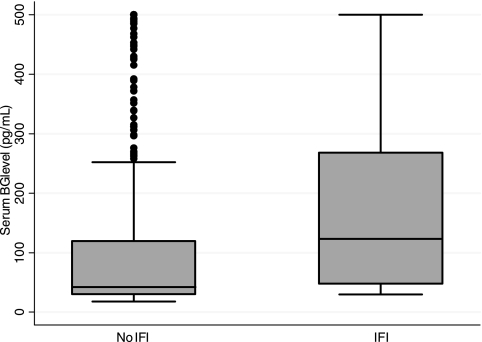
FIG. 1.
Distribution of (1,3)β-d-glucan (BG) levels in patients with (n = 14 subjects, 41 samples) and without (n = 59 subjects, 756 samples) proven or probable invasive fungal infection (IFI). For the box-and-whiskers plot, a horizontal line in the middle of the box represents the median; the top and bottom of the box show the 75th and 25th percentiles, respectively; and the top and bottom of whiskers show the 5th and 95th percentiles, respectively.

