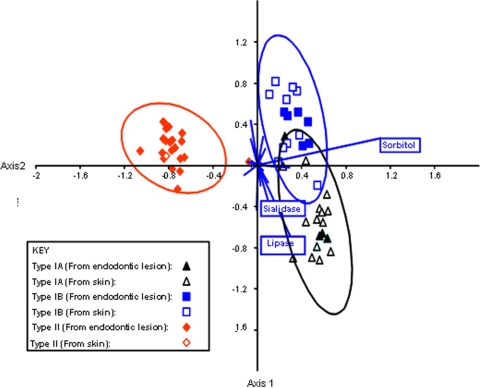
FIG. 4.
Phenotypic differences between P. acnes type IA, type IB, and type II. The chart is a canonical variance analysis scatter plot of isolates along the first two canonical axes, showing maximal separation between the three groups. The null hypothesis of no phenotypic difference between the three groups was tested by multivariate analysis of a variance (P < 0.01, Bonferroni-corrected P values for comparison of pairs of groups) and nonparametric analysis of similarities (P < 0.001, Euclidean distance measure). The biplot (blue lines) displays the contribution of individual tests to the separation; the three most important tests are indicated.

