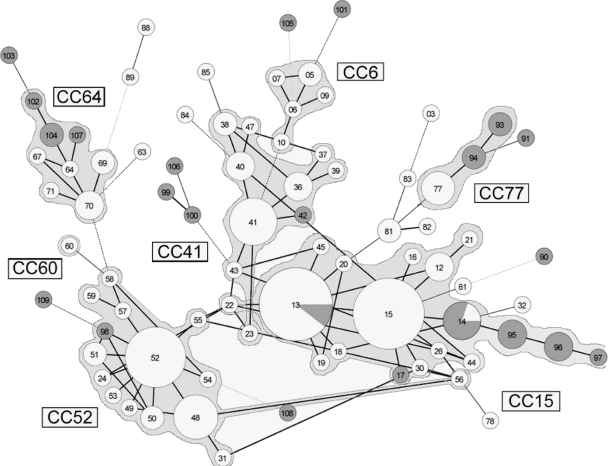
FIG. 2.
Minimum spanning tree analysis of 170 C. glabrata strains based on allelic profiles at eight microsatellite loci. Each circle corresponds to a repeat type, the number of which is indicated inside the circle. The lines between circles indicate the similarity between profiles (bold, seven alleles in common; normal, six alleles; dotted, five alleles). Gray parts of circles indicate proportions of genotypes that contain digestive isolates. Cross-links corresponding to a single allelic mismatch are shown.

