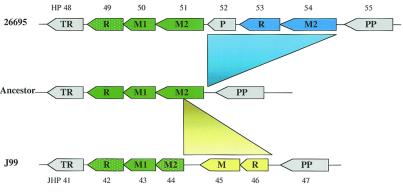
Figure 2.
Schematic diagram showing the possible evolution of HP49–54 in strain 26695 and JHP42–46 in strain J99 from a putative ancestral locus. The shared Type II R-M systems are shown in green. The strain-specific Type II R-M system in strain 26695 is shown in blue, and the strain-specific Type II R-M system in J99 is shown in yellow. Functional genes are shown in solid colors and inactive genes are patterned with white dots. Non-R-M genes are shown in gray. R, restriction endonuclease gene; M, DNA methylase gene; P, putative gene; TR, transcriptional regulator gene; PP, proline permease gene. HP numbers are marked above the genes and JHP numbers are marked below the genes.

