
Figure 2.
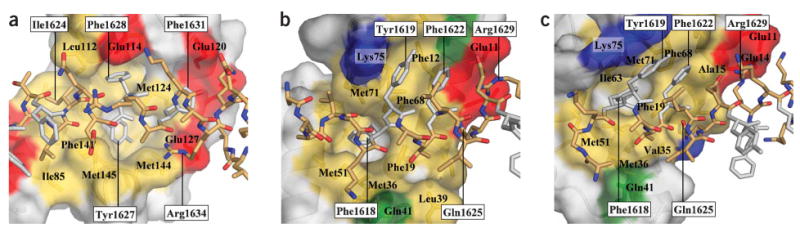
Lobe-specific Ca2+/CaM–CaV1.2 IQ domain interactions. (a) Ca2+/CaM C lobe from complex A bound to the IQ domain. Buried surface area = 1,819 Å2 (965 Å2 hydrophobic). (b) Ca2+/CaM N lobe from complex A bound to the IQ domain. Buried surface area = 1,450 Å2 (743 Å2 hydrophobic). (c) Ca2+/CaM N lobe from complex C bound to the IQ domain. Buried surface area = 1,491 Å2 (500 Å2 hydrophobic). IQ domain is shown in stick representation with aromatic anchor residues in white. CaM lobes are shown in surface representation with residues that contribute hydrophobic (yellow), negatively charged (red), positively charged (blue) and polar (green) side chain contacts (≤4 Å) to the IQ domain indicated. Select residues are labeled to orient the reader. IQ domain residue labels are boxed.