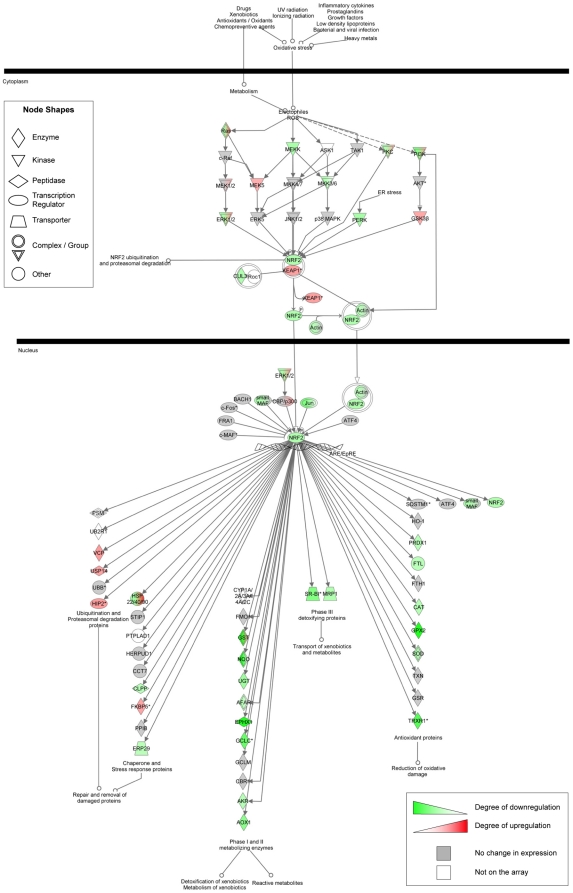
Figure 6. Differential expression of genes in the canonical Nrf2-mediated oxidative stress response pathway.
Genes are represented as nodes, biological relationships between two nodes as lines. The intensity of the node color indicates the degree of up- (red) or down- (green) regulation in CRI-G1-RS cells relative to CRI-G1-RR cells; gray node color indicates genes showing no differential expression between RR and RS cells, while white node color marks genes that were not present on the array. Protein complexes/gene groups are indicated by nodes with double outlines; color shading within such a node indicates that genes within the complex/gene group showed different expression changes. The analysis was performed on 3917 probes with FDR-adjusted p-value≤0.001, regardless of the fold change. When multiple probes were present for a single gene, the probe with the smallest p-value was used.

