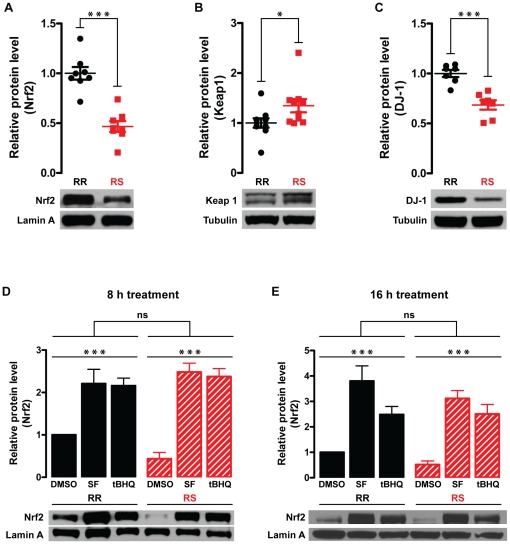
Figure 7. Differential expression of Nrf2, Keap1, and DJ-1.
A. At baseline, Nrf2 protein level (apparent MW, 77 kDa) in the nuclear fraction is significantly lower in CRI-G1-RS than RR cells. B. At baseline, Keap1 protein level (apparent MW, 69 kDa) in the whole cell lysate is significantly higher in CRI-G1-RS than RR cells. C. At baseline, DJ-1 protein level (apparent MW, 21 kDa) in the whole cell lysate is significantly lower in CRI-G1-RS than RR cells. D and E. Treatment with 5 µM SF or 10 µM tBHQ for 8 h (D) or 16 h (E) activated Nrf2 pathway to a similar extent in both CRI-G1-RR and RS cells. Apparent MW for lamin A was 68 kDa; for tubulin, 51 kDa. In panels A–C, statistical significance was determined by two-tailed Student's t-test; scatter plots of all data points are shown. In panels D and E, statistical significance was determined by two-way ANOVA; data are plotted as mean ± S.E.M. (n = 5). While there was no statistically significant difference between the two cell types overall, ad-hoc Bonferroni post-tests detected a statistically significant difference between DMSO-treated RR and RS samples (p<0.01), similar to the difference observed with untreated samples (panel A). *, p<0.05; ***, p<0.001.

