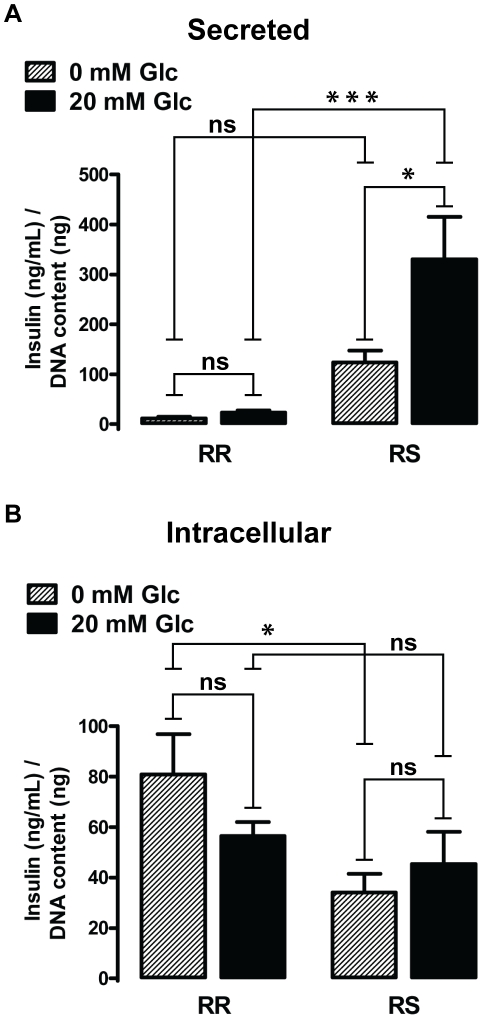
Figure 10. Differences in glucose-induced insulin secretion and intracellular insulin content.
A. Insulin secretion is induced by 20 mM glucose in RS but not in RR cells. B. Intracellular insulin content is modestly but significantly lower in RS than RR cells at 0 mM glucose; there is no difference between the two cell types following the high glucose challenge. Statistical significance was determined by two-way ANOVA followed by ad-hoc Bonferroni post-tests (n = 4); all data are plotted as mean ± S.E.M. *, p<0.05; ***, p<0.001.

