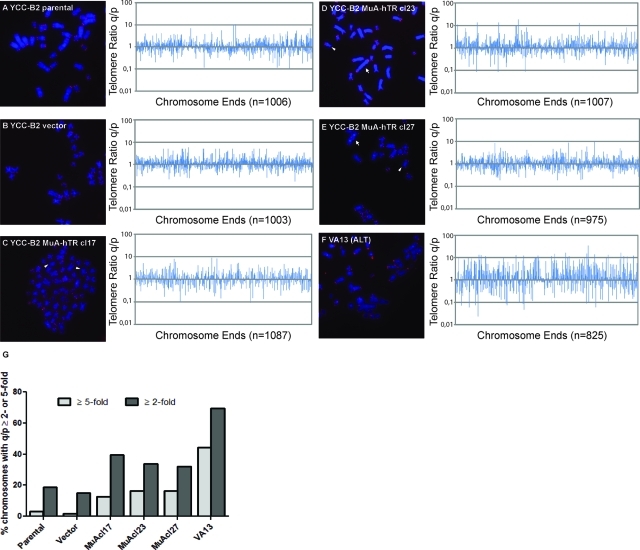
FIGURE 3:
Pq ratio variation is increased in cells expressing MuA-hTR. (A–F, left panel) Representative FISH images of metaphase spreads of YCC-B2 parental, vector-containing, MuA-hTR–expressing, and VA13 control cells. Telomeres were hybridized with a Cy3-[CCCTAA]3 telomere probe (red), and chromosomes were stained with DAPI (blue). Cy3 signal intensity correlated with telomere length. Arrows show examples of telomere fusions with detectable telomere signal at the site of fusions. Arrowheads indicate telomere ends without detectable signal (signal-free ends [SFEs]). (A–F, right panel) The ratios (q/p) of telomere signals for the q arm and the p arm for different chromosomes are plotted along the x-axis of the graph from left to right. The distribution of the changes along the x-axis of each graph demonstrates that changes in pq ratios were observed in all metaphases examined and cannot be attributed to changes in only a subset of metaphases. Telomere ratios (q/p) are represented on a log scale on the y-axis. SFEs and telomere fusions were given a pq ratio value of 5 but were excluded from these graphs for better clarity. The total number of chromosome ends analyzed is indicated below graphs. (G) The percentage of chromosomes with a telomere pq ratio greater than twofold (q/p ≥ 2 or q/p ≤ 0.5) or telomere pq ratio greater than fivefold (q/p ≥ 5 or q/p ≤ 0.2) is represented.

