FIGURE 5:
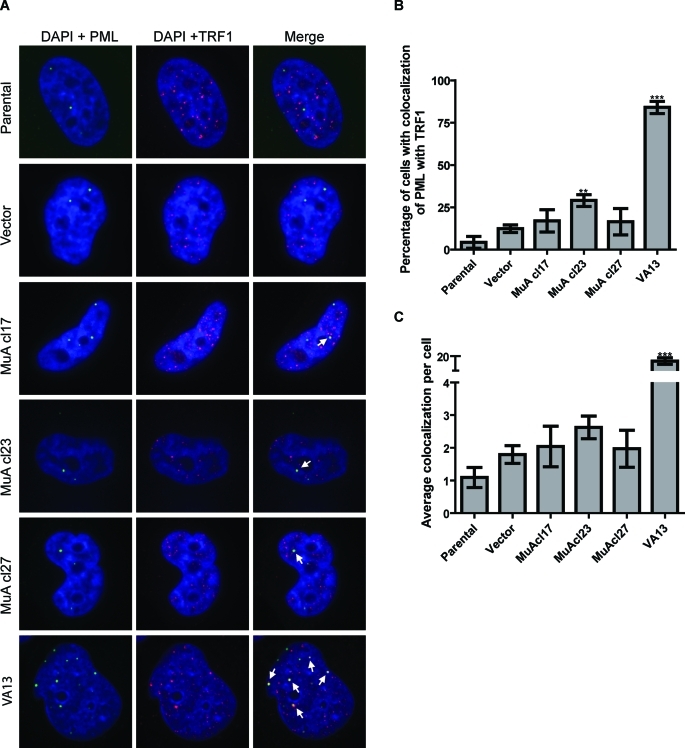
MuA-hTR–expressing cells contain APBs. (A) Immunostaining with an antibody against the PML protein (N-19, green) and an antibody against the telomeric-binding protein TRF1 (#370, red). APBs were detected by the colocalization of the fluorescent signals in merged images (yellow). Images represent only one slice in the Z-stack. Arrows indicate colocalization. (B) Quantification of APBs in the YCC-B2 MuA-hTR–expressing cells compared with parental, vector-containing, and VA13 control cells. The percentage of cells showing four or more colocalization events per nucleus is shown. A minimum of 50 cells were scored for each population. Three-dimensional images were obtained using a Leica DMI600B confocal laser scanning microscope (63×), and colocalization was analyzed with Volocity 5.4.1 software. (C) The average number of APBs per cell is represented. Data are mean ± SEM for three independent experiments. Asterisks indicate significant differences from vector-containing cells (***P < 0.001 and **P < 0.01).

