FIGURE 2:
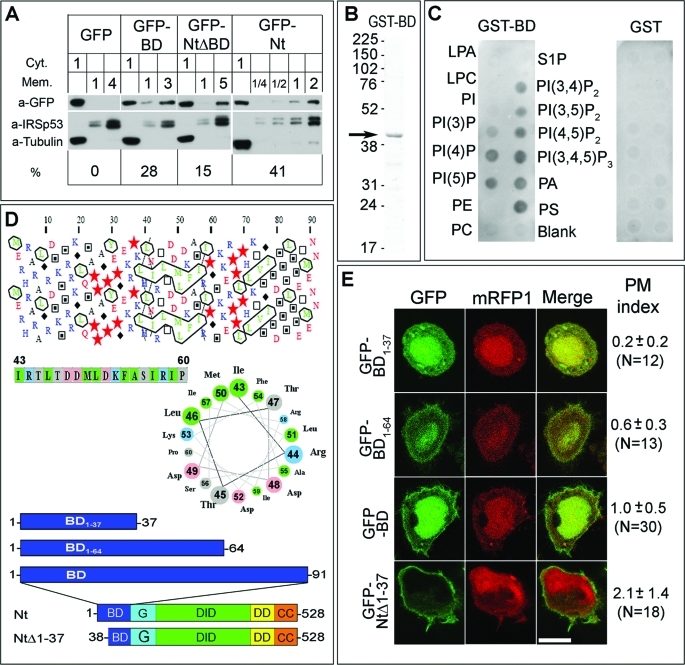
The BD of mDia2 is important for plasma membrane targeting and binds acidic phospholipids in vitro. (A) Subcellular fractionation of HeLa cells expressing GFP fusion proteins. Cytoplasmic (Cyt) and membrane (Mem) fractions of cells expressing indicated constructs (top row) were loaded on the gel in volume equivalents shown by numbers above the corresponding lanes. Western blotting with GFP antibody was used to detect the expressed proteins. Tubulin and IRSp53 were used as cytoplasmic and plasma membrane markers, respectively, to confirm successful fractionation. Calculated percentage of GFP fusion proteins in the membrane fraction (%) is shown at bottom. (B) Purified GST-BD (arrow) shown by Coomassie staining of SDS–PAGE gel. (C) Protein-lipid overlay assay showing GST-BD binding to acidic, but not neutral phospholipids (left panel). No binding is detected for GST alone (right panel). Abbreviations: LPA, lysophosphatidic acid; LPC, lysophosphocholine; PI, phosphatidylinositol; PI(3)P, phosphatidylinositol-3-phosphate; PI(4)P, phosphatidylinositol-4-phosphate; PI(5)P, phoshphatidylinositol-5-phosphate; PE, phosphatidylethanolamine; PC, phosphatidylcholine; S1P, sphingosine-1-phosphate; PI(3,4)P2, phosphatidylinositol-3,4-bisphosphate; PI(3,5)P2, phosphatidylinositol-3,5-bisphosphate; PI(4,5)P2, phosphatidylinositol-4,5-bisphosphate, PI(3,4,5)P3, phosphatidylinositol-3,4,5-trisphosphate; PA, phosphatidic acid; PS, phosphatidylserine. (D) Secondary structure predictions for the basic domain of mDia2. Top: Hydrophobic cluster analysis (HCA) reveals abundance of positively charged residues (blue) in the 1–20 region and two putative hydrophobic clusters in the 40–60 and 70–80 regions (outlined). In the HCA, stars are prolines, black diamonds are glycines, and empty and filled squares are threonines and serines, respectively. Middle: Helical wheel presentation of a putative amphipathic helix for amino acids 43–60 corresponding to the first hydrophobic cluster in the HCA plot. Nonpolar residues are clustered on the upper left side of the wheel. Bottom: Diagrams of mDia2 constructs used in panel E. (E) Confocal microscopy images of HeLa cells coexpressing indicated GFP-mDia2 fusion constructs and mRFP1 as a cytoplasmic marker. Average PM indices with standard deviations and numbers of quantified cells in parenthesis are shown to the right of the merged images. Scale bar, 10 μm.

