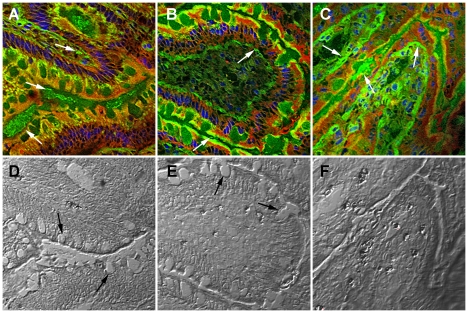
Figure 3. Changes in intestinal permeability induced by gliadin and various bacterial strains.
Intestinal loops were exposed to: gliadin fragments with IFN-γ and B. bifidum IATA-ES2 (A,D), gliadin+IFN-γ+E. coli CBL2 (B,E) and Shigella CBD8+gliadin+IFN-γ (C,F); The white arrows indicate gliadin fragments found by immunofluorescence (A–C) using mouse peroxidase-labeled monoclonal anti-gliadin antibody and TSA™ Plus Fluorescence systems and black arrows indicate goblet cells (D, E). Bacteria were applied at 106/loop. The specimens were viewed under confocal microscope Olympus FV 1000 SIM using differential interference contrast (D–F). Scale bar, 20 µm.

