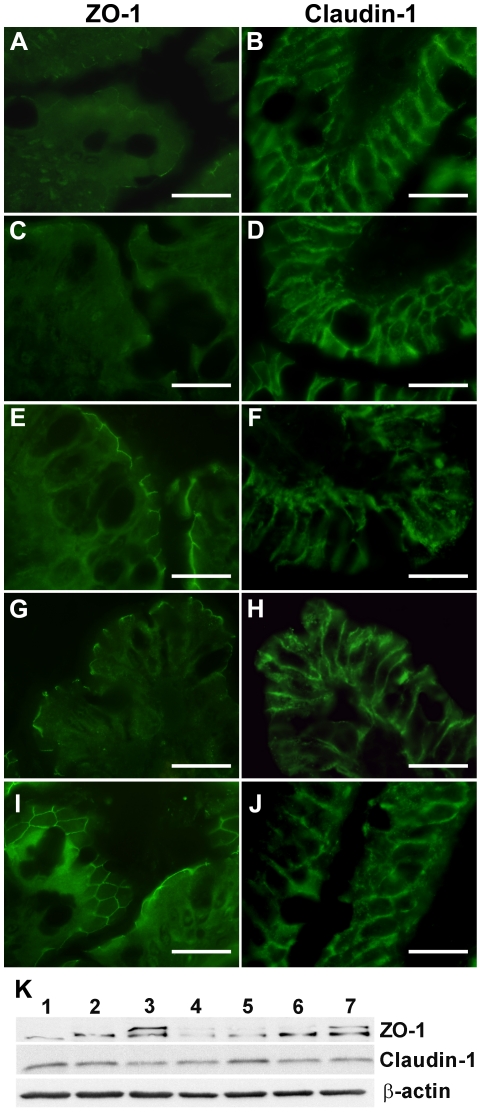
Figure 4. Distribution of claudin-1 and ZO-1 in rat intestinal loops.
Exposure of intestinal tissue to gliadin digest alone (A) or with IFN-γ (C) led to reduced ZO-1 expression at the periphery of the villi. The combination of gliadin+IFN-γ+B. bifidum IATA-ES2 (E) maintained the original level of ZO-1 as in PBS-treated loops (I). When gliadin+IFN-γ were applied with E. coli CBL2 (G) ZO-1 fluorescence was weaker. No changes in claudin-1 localization (B, D, F, H) were detected after any stimulus in comparison with PBS control (J). Representative pictures of three experiments are shown. The specimens were viewed under an Olympus BX 40 microscope. Scale bar, 20 µm. Western blot of tissue lysates (K) from intestinal loops stimulated with: 1. gliadin, 2. gliadin+IFN-γ, 3. B. bifidum IATA-ES2+gliadin, 4. E. coli CBL2+gliadin +IFN-γ, 5. E. coli CBL2+B. bifidum IATA-ES2+gliadin+IFN-γ, 6. B. bifidum IATA-ES2+gliadin+IFN-γ, and 7. PBS. The separated proteins on membranes were stained with anti ZO-1 or claudin-1 antibodies and re-probed with antibodies against β-actin to document the same protein concentration in all samples.

