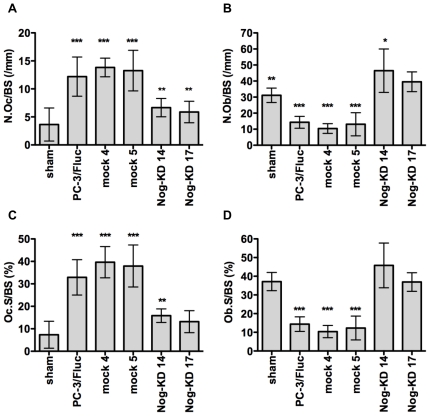
Figure 5. Noggin silencing normalizes the bone histomorphometric indexes of bone formation and resorption in osteolytic lesions.
A. Number of osteoclasts (N.Oc/BS; /mm, +/− SD) on the endosteal surface in trabecular and cortical bone of sham-operated tibiae or on residual bone adjacent to cancer cells of tibiae xenografted with PC-3/Fluc, mock and Nog-KD clones. n = 6–7 animals for each experimental group. ***P<0.001, PC-3/Fluc and mock clones versus sham, and mock clones versus Nog-KD 17; **P<0.01, Nog-KD 17 versus PC-3/Fluc, and Nog-KD 14 versus PC-3/Fluc and mock clones. B. Number of osteoblasts (N.Ob/BS; /mm, +/− SD) on the endosteal surface in trabecular and cortical bone of sham-operated tibiae or on residual bone adjacent to cancer cells of tibiae xenografted with PC-3/Fluc, mock and Nog-KD clones. n = 6–7 animals for each experimental group. ***P<0.001, PC-3/Fluc and mock clones versus Nog-KD clones, and mock 4 versus sham; **P<0.01, sham versus PC-3/Fluc and mock 5; *P<0.05, Nog-KD 14 versus sham. C. Percentage of endosteal surface in cortical and trabecular bone occupied by osteoclasts (Oc.S/BS; %, +/− SD) in sham-operated and cancer cell-xenografted tibiae. n = 6–7 animals for each experimental group. ***P<0.001, mock clones versus sham and Nog-KD clones, and PC-3/Fluc versus sham and Nog-KD 17; **P<0.01, Nog-KD 14 versus PC-3/Fluc. D. Percentage of endosteal surface in cortical and trabecular bone occupied by osteoblasts (Ob.S/BS; %, +/− SD) in sham-operated and cancer cell-xenografted tibiae. n = 6–7 animals for each experimental group. ***P<0.001, PC-3/Fluc and mock clones versus sham and Nog-KD clones.

