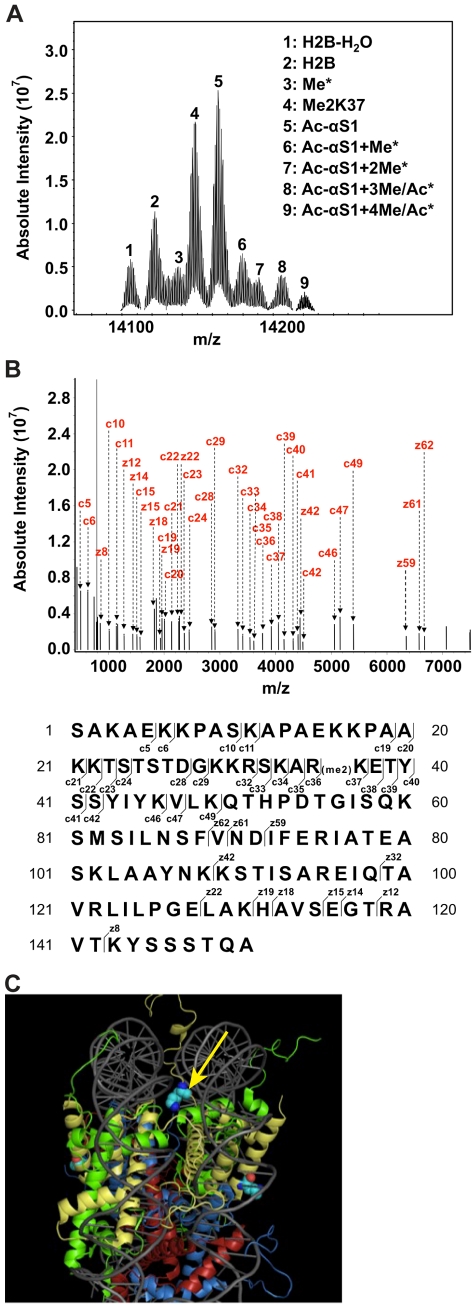
Figure 1. Top-down mass spectrometry (MS) analysis reveals histone H2B is dimethylated at lysine 37.
(A) Top-down μESI-FTICR-MS analysis of yeast histone H2B. Shown is a mass spectrum of H2B revealing multiply modified forms of this histone, as indicated by peaks numbered 1–9. Each peak was analyzed by top-down μESI-FTICR-MS/MS analysis and modifications identified are denoted in the legend. Asterisks indicate PTMs that were not assigned. 100 scans per spectrum were acquired in the ICR cell with a resolution of 580,000 at m/z 400 Da. (B) Top-down μESI-FTICR-MS/MS analysis of peak 4. ECD MS/MS spectrum of histone H2B with two methyl marks (precursor: m/z 1415.9 Da, 10+ charge state) reveals lysine 37 is dimethylated. N-terminal (c ions) and C-terminal (z ions) fragment ions are assigned and shown in the upper panel. Lower panel denotes the ions in the sequence. Unassigned ions are either internal fragment ions or electronic noise. 100 scans per spectrum were acquired in the ICR cell with a resolution of 580,000 at m/z 400 Da. (C) Lysine 37 of H2B is located within the DNA gyres in the nucleosomal structure. Histones H2A, H2B, H3 and H4 are shaded green, yellow, red, and blue, respectively. The DNA backbone is colored gray. The yellow arrow points to the location of lysine 37 of histone H2B. The nucleosomal representation was generated using open-source PyMOL software (PyMOL 0.99rev10, DeLan Scientific LCC) with structural data taken from [100] (PDB file 1kx5).

