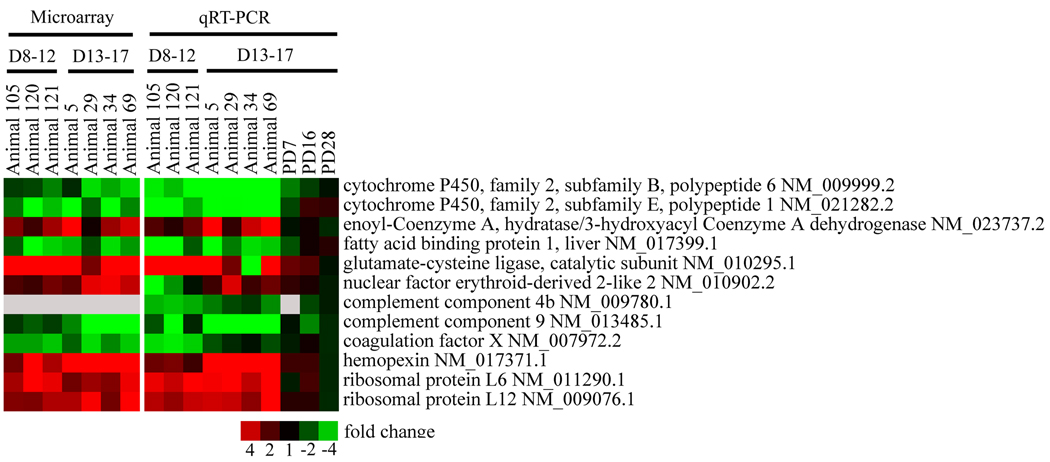
Fig. 6.
Real-time PCR evaluation of selected genes. Good agreement was found between the results from either microarray or RT-PCR analysis. Differences were observed with respect to expression of Nrf2, especially among animals dosed on GD8–12, although increased expression of glutamate cysteine ligase (Gclc), an Nrf2 regulated gene, was confirmed in all but one animal. Red or green correspond to up- or down- regulation, respectively.

