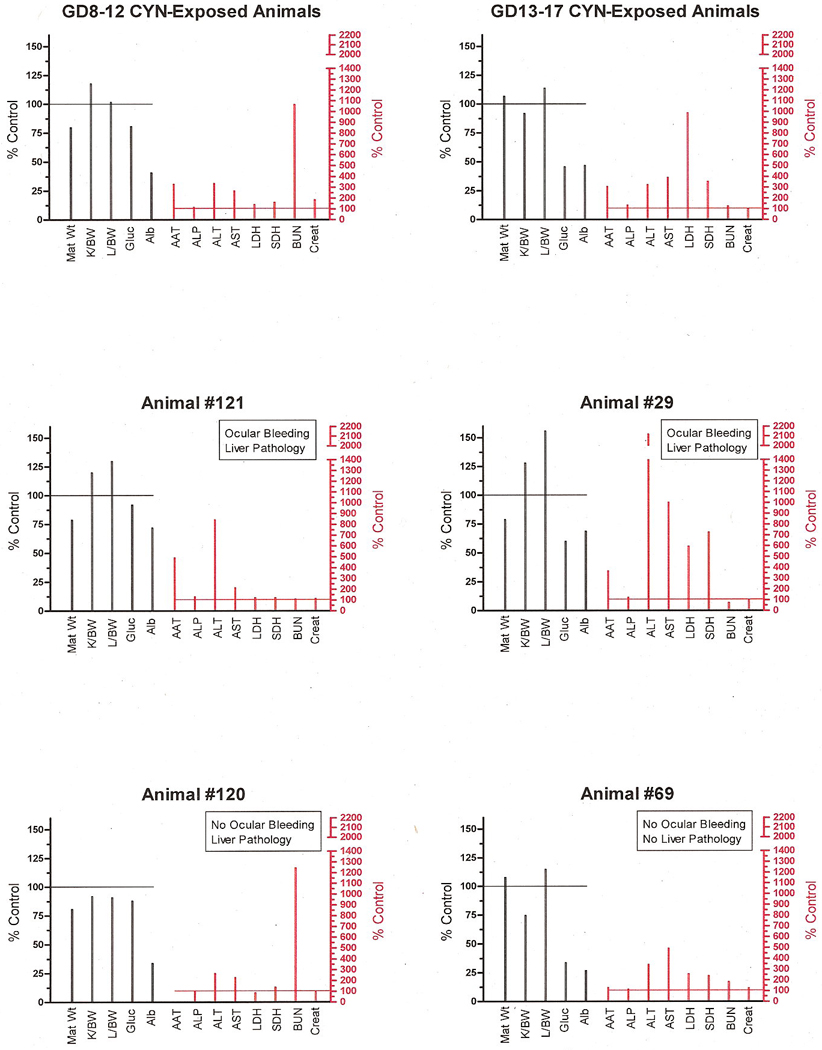
Fig. 7.

Toxicity profiles of avg. GD8–12 and GD13–17 animals’ responses to CYN and individual animals within each of these dosing regimen groups. The left “Y” axis represents data on body and organ weights and general markers of metabolic homeostasis compared to control values (controls = 100%). The right “Y” axis shows the degree of change in the hepatic and renal markers of toxicity as a percent of the control values (controls =100%).
