Abstract
Short-chain fatty acids (SCFAs) are the major by-products of bacterial fermentation of undigested dietary fibers in the large intestine. SCFAs, mostly propionate and butyrate, inhibit proliferation and induce apoptosis in colon cancer cells, but clinical trials had mixed results regarding the anti-tumor activities of SCFAs. Herein we demonstrate that propionate and butyrate induced autophagy in human colon cancer cells to dampen apoptosis whereas inhibition of autophagy potentiated SCFA induced apoptosis. Colon cancer cells, after propionate treatment, exhibited extensive characteristics of autophagic proteolysis: increased LC3-I to LC3-II conversion, acidic vesicular organelle development, and reduced p62/SQSTM1 expression. Propionate-induced autophagy was associated with decreased mTOR activity and enhanced AMP kinase activity. The elevated AMPKα phosphorylation was associated with cellular ATP depletion and overproduction of reactive oxygen species due to mitochondrial dysfunction involving the induction of MPT and loss of Δψ. In this context, mitochondria biogenesis was initiated to recover cellular energy homeostasis. Importantly, when autophagy was prevented either pharmacologically (3-MA or chloroquine) or genetically (knockdown of ATG5 or ATG7), the colon cancer cells became sensitized toward propionate-induced apoptosis through activation of caspase-7 and caspase-3. The observations indicate that propionate-triggered autophagy serves as an adaptive strategy for retarding mitochondria-mediated apoptotic cell death, whereas application of an autophagy inhibitor (Chloroquine) is expected to enhance the therapeutic efficacy of SCFAs in inducing colon tumor cell apoptosis.
Keywords: short-chain fatty acids, autophagy, apoptosis, mitochondrial, colon cancer
Short-chain fatty acids (SCFAs) are the major by-products of the bacterial fermentation undigested dietary fibers in the human intestine.1 The molar ratio among the three major SCFAs is ∼60:25:15 for acetate (2C):propionate (3C):butyrate (4C).2 SCFAs are reported to induce differentiation, growth arrest and apoptosis in colon cancer cells.3 The anticancer effect of SCFAs is also supported by epidemiological studies indicating that a diet high in fiber is associated with a decreased incidence and growth of colon cancers.4
Autophagy is an evolutionarily conserved catabolic process in which the cytoplasmic contents and organelles are transferred into double membrane vesicles, called ‘autophagosomes'.5 Autophagosome ultimately fuses with a lysosome, where its contents are broken down by degradative enzymes and subsequently recycled.6 Autophagy is responsible for the turnover of intracellular long-lived proteins and damaged organelles during cellular homeostasis. Autophagy has important roles in tissue development, differentiation and remodeling.7 It is also implicated in diseases such as tumor development, but its precise role is ambiguous.
A number of antineoplastic therapies, including radiotherapy and DNA-damaging chemotherapy, have been observed to induce autophagy.8, 9 Whether autophagy induced by antineoplastic therapies facilitates tumor cell death or represents a self-defense mechanism for resisting therapy remains controversial. Several observations support the argument that autophagy is detrimental to cancer cell survival, including the fact that the ability of radiation or chemotherapy to induce cell death in cancer cell lines that display resistance to apoptosis depends on autophagy induction.8 On the other hand, mounting evidence suggests that autophagy represents a self-protective strategy against antineoplastic treatment by abrogating apoptosis.10 These seemingly contradictory findings indicate that there is not a unique paradigm addressing the role of autophagy in tumorigenesis. Accordingly, it is conceivable that autophagy may have different roles in the different stages, or contexts, of tumorigenesis.
Evidence to date indicates that the antitumor effect of SCFAs is based on their ability to induce apoptotic cell death (Type I Programmed cell death (PCD)) in colon cancer cells.11 Interestingly, SCFAs have been reported to increase the expression of a broad range of mitochondria-related genes and a spectrum of genes related to protein turnover, but the physiological relevance is yet to be understood.12 Herein we report that SCFAs, particularly propionate, induced autophagy and induction of autophagy attenuated the therapeutic efficacy of SCFAs toward colon cancer.
Results
Induction of autophagy by propionate in colon cancer cells
SCFAs, particularly propionate and butyrate, are well-known for their antitumor effects toward colon cancer.13 In agreement with these reports, propionate inhibited HCT116 and SW480 cells with IC50 of 9 and 20 mM, respectively, whereas butyrate was more cytotoxic with an IC50 of 5 mM (Supplementary Figure S1).
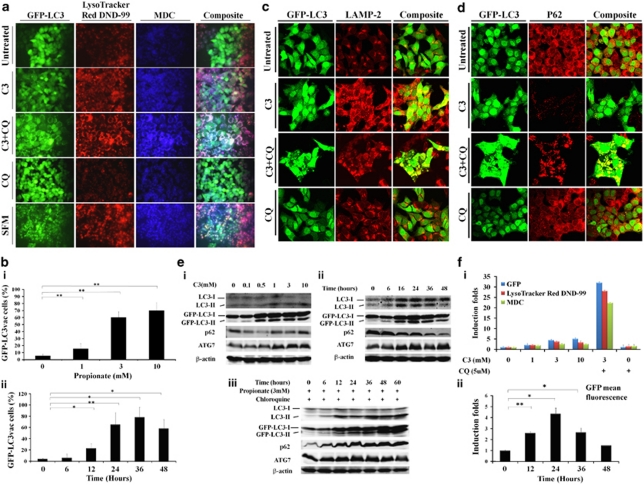
The re-distribution of GFP-LC3 to easily visualized ‘puncta' is a commonly used technique to monitor the autophagosome formation during autophagy. Propionate exposure prominently triggered the formation of characteristic punctate GFP-LC3, suggesting the recruitment of GFP-LC3 during autophagosome formation (Figure 1a). Treatment with propionate (3 mM) resulted in a 10-fold increase in the percentage of cells with punctate GFP-LC3 compared with cancer cells treated with PBS by 36 h (Figure 1bi). Propionate induced autophagy in a time-dependent manner (Figure 1bii). Lysosomal-associated membrane protein 2 (LAMP-2), an important constituent of the lysosomal membrane, has been reported to be critical for the lysosomal degradation of autophagic vacuoles.14 Propionate caused an extensive upregulation of LAMP-2 expression (Figure 1c and Supplementary Figure S2a). The upregulated LAMP-2 displayed punctate structures and colocalized with GFP-LC3 dots, indicating autolysosome formation. The formation of punctate GFP-LC3 after propionate treatment was not confined to HCT116 cells but was also observed in SW480 cells with stable GFP-LC3 expression (Supplementary Figure S2d and e). Butyrate induced autophagy in both HCT116 and SW480 cells in a manner similar to propionate (Data not shown).
Figure 1.
Induction of autophagy by propionate in colon cancer cells. (a) A bulk population of HCT116 cells with stable GFP-LC3 expression was treated with propionate (C3, 3 mM) for 36 h or was starved within serum-free medium (positive control) for 24 h. Formation of acidic vesicular organelles was monitored by LysoTracker DND-99 or MDC staining. Chloroquine (CQ) (5 μM) was added to increase the accumulation of autophagosomes. Representative images of cells were taken with a fluorescence microscope at × 600 magnification. Note the pink color in a composite panel showing the colocalization of pucutate GFP-LC3, LysoTracker DND-99 and MDC staining. (b) Quantification of the percentage of cells with more than eight GFP-LC3 puncta per cell is represented as ‘GFP-LC3vac cells (%)'. GFP-LC3 expressing cells were treated with indicated concentrations of propionate for 36 h (i). The percentage of cells with punctate GFP-LC3 caused by 3 mM propionate was monitored at different time points (ii). A minimum of 100 GFP-LC3 expressing cells were counted. *P<0.01; **P<0.001, compared with PBS control at the corresponsding time. HCT116 cells were treated with propionate (3 mM) in the presence or absence of CQ (5 μM) for 24 h. The cells were stained with LAMP-2 antibody (c) or p62 antibody (d). Representative images of cells were taken with an Olympus Fluoview confocal microscope using a × 60 oil immersion objective lens. (e) HCT116 cells with stable GFP-LC3 expression were subjected to propionate at different concentrations (i) or propionate (3 mM) for the indicated times (ii). The cell lysates were immunoblotted against several autophagy markers. Autophagy markers were also examined in the cells treated with propionate in the presence of CQ (iii). (f) Increased acidic vesicular organelle formation was reflected by elevated punctate LysoTracker staining and increased MDC incorporation in HCT116 cells after propionate treatment. HCT116 cells were subjected to propionate at different concentrations (i) or propionate (3 mM) for the indicated times (ii). The cells were stained with the dyes and subjected to flow cytometry analysis. The bars represent the mean±S.E. (n=4). *P<0.01; **P<0.001, compared with PBS control at the corresponsding time
During autophagosome formation, nascent LC3 is processed into soluble form LC3-I, which is further modified to form autophagosomal membrane-incorporated LC3-II, and the latter protein can be separated from the nonconjugated form (LC3-I) and detected by immunoblotting. Immunoblot analyses revealed the presence of LC3-II after propionate treatment, and the level of LC3-II reached the highest level by 3 mM of propionate treatment (Figure 1ei). The degree of LC3-I to LC3-II conversion was initially low (as early as 6 h posttreatment with propionate) but significantly enhanced thereafter (Figure 1eii). Aside from LC3, p62/SQSTM1, another biochemical sign of autophagy, was reduced (Figure 1d, 1ei and ii and Supplementary Figure S2b). On the other hand, the level of ATG7, which is essential for autophagosome formation, was upregulated. Propionate also increased the conversion of LC3-I to LC3-II and of GFP-LC3-I to GFP-LC3-II and reduced the p62 level in SW480 cells (Supplementary Figure S2g).
Cells undergoing autophagy generally develop double-membraned, acidic vesicular organelles (autophagosomes), which can be detected by specific dyes. Treatment of HCT116 cells with increasing concentrations of propionate resulted in a progressive increase in LysoTracker or MDC-stained autolysosome-like structures, which resembled punctates (Figure 1a and 1fi). Furthermore, GFP-LC3 punctates were largely colocalized with LysoTracker and MDC staining, indicating the formation of autolysosomes. The formation of autophagic vacuoles peaked at a propionate treatment with a concentration of 3 mM and could not be further promoted by increasing the propionate concentration (Figure 1fi). Propionate also increased the number of autophagic vacuoles in SW480 cells (Supplementary Figure S2d and f). Taken together, we conclude that formation of cytoplasmic acidic vesicular organelles, which is characteristic of autophagy, occurred in propionate treated cells.
Because LC3-II is subject to lysosomal degradation during autophagy, increased LC3-II levels do not always accurately reflect full-fledged autophagy induction. Instead, LC3-II accumulation could occur when downstream protein degradation is impaired. To assess autophagic flux more precisely, we assessed the accumulation of LC3-II in the presence of lysosomotropic agent chloroquine (CQ), which blocks the last critical step in autophagy, the acid-dependent degradation of autophagosome contents. A combination treatment with propionate and CQ resulted in the accumulation of LC3-positive vesicles and caused an up to 10-fold increase in punctate LC3 fluorescence after 24 h (Figure 1a and f). A further accumulation of LC3-II, GFP-LC3-II and p62 was detected (Figure 1c and eiii). We also found that CQ substantially promoted the accumulation of acidic vesicular organelles (Figure 1a and f). Taken together, these observations further support the conclusion that propionate-mediated increase in LC3-II expression was a consequence of accelerated autophagosome formation, rather than impaired lysosomal clearance.
Propionate induced autophagy activation is associated with mTOR pathway inhibition
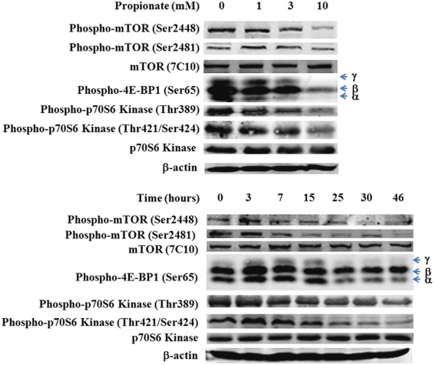
Autophagy regulation is a complex process that depends on a spectrum of factors. It is well established that the mammalian target of rapamycin (mTOR) negatively regulates autophagy.15 mTOR autophosphorylation at Ser2481 is regarded as an indicator for its catalytic activity. Western blot analysis revealed that propionate caused a strong time-dependent reduction in the phosphorylation state of mTOR at Ser2481, whereas the total mTOR level was not changed noticeably (Figure 2). Immunoblotting analyses revealed a clear decrease in phosphorylation of eukaryotic initiation factor 4E-binding proteins (4E-BP1), a key downstream effector of mTOR activity,16 in a dose- and time-dependent manner after exposure to propionate (Figure 2). Further, we analyzed the phosphorylation status of another major mTOR substrate p70S6K, whose phosphorylation status at Thr389 has been described to reflect mTOR activity,17 whereas phosphorylation at Thr421/Ser424 is thought to activate p70S6K through the relief of pseudo substrate suppression. Reduced phosphorylation of p70S6K at Thr389 was noted by 7 h following propionate treatment, and by 25 h, a measured three-fold decrease in the ratio of p70S6K (P-Thr389) to total p70S6K was observed (Figure 2). The level of p-p70S6K on Thr421/Ser424, showed a pattern similar to p-p70S6K on Thr389. We also found that the phosphorylation of mTOR at Ser-2448, which was reported to be the target of p70S6 kinase,18 was reduced as well. Propionate also inhibited mTOR pathway in SW480 cells (Supplementary Figure S3). Collectively, these observations confirmed that downregulation of the mTOR signaling pathway is a mechanism for propionate to induce autophagy.
Figure 2.
Propionate-induced autophagy activation is associated with mTOR pathway inhibition. HCT116 cells were treated with propionate at different concentrations (top) for 15 h or with 3 mM propionate for the indicated time (bottom). The phosphorylation status of mTOR and its major downstream substrates, 4E-BP1 and p70S6 kinase, was detected by western blot. As for 4E-BP1 phosphorylation, γ stands for the hyper-phosphorylated form of 4E-BP1, whereas β and α stand for medium- and low-phosphorylated forms of 4E-BP1. The data represent as least three independent experiments
SCFA downregulation of mTOR pathway is associated with AMPK pathway activation
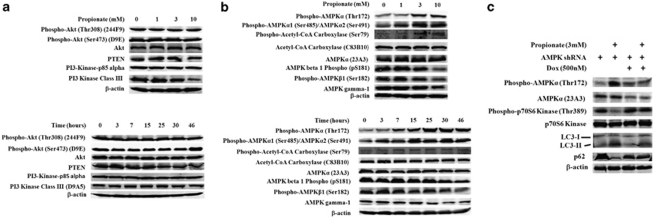
To characterize the molecular mechanisms underlying the reduced mTOR activation and concomitant autophagy induction by SCFA, we investigated the activation status of upstream signaling events involved in mTOR regulation. Of note, two separate pathways leading to the activation of mTOR have been well established: the oncogenic Akt/protein kinase B-PI3 K pathway, which activates mTOR in response to the introduction of nutrient and growth factors, and the AMP-activated protein kinase (AMPK) pathway, which inhibits mTOR activity in response to metabolic stresses such as nutrient starvation-induced cellular ATP depletion.19 We firstly hypothesized that propionate induced mTOR signaling activation might be resulted from PI3K-Akt pathway inhibition. Immunoblot analysis did not detect any noticeable difference in the phosphorylation of Akt at either Thr308 or Ser473, and the expression level of class I/III PI3-kinases (Figure 3a). The level of non-phosphorylated Akt was not changed either. Interestingly, a slight but consistent decrease in PTEN expression was observed (Figure 3a). The data suggest that the downregulation of the PI3K-Akt signaling pathway is not involved in propionate-induced downregulation of mTOR pathway.
Figure 3.
Induction of autophagy through inhibition of mTOR pathway is associated with AMPK pathway activation. HCT116 cells were treated with propionate at the indicated concentrations for 15 h or with 3 mM propionate for the indicated times. (a) The expression level of Phospho-Akt, PTEN and Class I/III PI3 Kinase were detected by western blot. (b) The phosphorylation status of AMPK α/β subunits and an AMPK downstream effector acetyl-coA carboxylase were detected by western blot. The data represent as least three independent experiments. (c) The expression level of AMPKα in the HCT116 cells, which are infected with AMPKα in the presence or absence of doxycycline (Dox) was examined. The direct downstream target of mTOR pathway (p70S6) and several autophagy markers were examined by western blot
Next, we analyzed whether AMPK signaling pathway activation is responsible for mTOR pathway inhibition during propionate treatment. As a primary sensor of cellular bioenergetics, the AMPK-mediated signaling pathway has been described to sense the intracellular energy status and to regulate cellular metabolism. AMPK has been reported to be a positive regulator of autophagy.20 Phosphorylation of AMPK at the α subunit at threonine 172 (Thr172) in response to an increased AMP to ATP ratio has been shown to be required for the activation of all known AMPK homologs.21 Propionate increased the phosphorylation level of AMPKα in HCT116 cells as early as 7 h following propionate treatment (Figure 3b). In addition, despite the report that phosphorylation of either Thr258 or Ser485/491 does not cause any detectable activation of AMPK,21 we observed an elevation in the phosphorylation of AMPKα at Ser485 for α1 and Ser491 for α2 (Figure 3b). Phosphorylation of one direct downstream target of AMPK, acetyl-coenzyme A carboxylase (ACC), was detected. Propionate also increased AMPKα phosphorylation at Thr172 in SW480 cells (Supplementary Figure S4).
AMPK exists in cells as a heterotrimeric complex composed of a catalytic kinase subunit (α) and two regulatory subunits (β and γ). The presence of β/γ subunits contributes to the stability of the α subunit, helps prevent the auto-inhibitory domain with its active site, and enhances the allosteric activation (Thr172 phosphorylation) by AMP. Contrary to the increased phosphorylation at Thr172 of the α subunit, propionate dramatically diminished the phosphorylation level of the AMPK β subunit at both Ser181 and Ser182, especially at a high concentration (10 mM) (Figure 3b). In addition, AMPK γ-1 was reduced as well (Figure 3b). Whether the decreased β1 subunit phosphorylation and γ expression have a part in the regulation of AMPK during propionate treatment awaits further investigation.
To further investigate the dependence of AMPK on propionate mediated mTOR signaling inhibition and autophagy activation, we used HCT116 cells infected with doxycycline-inducible expression of shRNAs against AMPKα. Consistent with the role of AMPK in downregulation of mTOR signaling activity, propionate-mediated inhibition of p70S6 kinase phosphorylation was markedly less pronounced in cells infected with AMPKα shRNA (Figure 3c). Propionate-triggered autophagy induction was also impaired in AMPKα shRNA-infected cells, thus confirming that AMPK activation was a principal mechanism underlying these events (Figure 3c). Taken together, we conclude that propionate induction of autophagy in HCT116 and SW480 cells is based on AMPK pathway activation, instead of a decrease in PI3K-Akt signaling, and subsequent downregulation of mTOR.
Propionate-induced AMPK signaling activation is associated with mitochondrial defect-induced cellular ATP depletion and oxidative stress
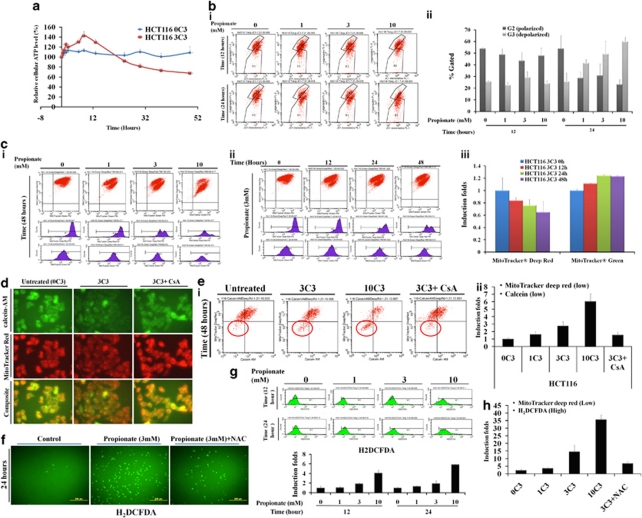
The data described above show that propionate inhibited the mTOR pathway by causing AMPK activation. AMPK is exquisitely sensitive to changes in the concentration of ATP. We therefore determined whether AMPK activation by propionate is caused by cellular ATP reduction. Figure 4a shows that after an acute increase starting from 30 min and lasting for up to 5 h, the intracellular ATP level declined steadily in HCT116 cells following propionate treatment. Propionate induced ATP reduction and AMP/ADP upregulation was further confirmed by HPLC (Supplementary Figure S5a). A similar ATP fluctuation pattern following propionate treatment was also observed in SW480 cells (Supplementary Figure S5b).
Figure 4.
Propionate-induced AMPK signaling activation is associated with mitochondrial defect-induced cellular ATP depletion and oxidative stress. (a) HCT116 cells were treated with propionate (3 mM) for the indicated times. The intracellular ATP level was measured using a CellTiter-Glo Luminescent Cell Viability Assay kit. The bars represent the mean±S.E. (n=4). (b) HCT116 cells were treated with propionate (0, 1, 3, 10 mM) for the indicated times and were stained against JC-1 for flow cytometry. There was a significant increase in the number of cells with lowered red fluorescence (FL-2 (R3)), indicating a change in the Δψ (i). The percentage of cells with polarized versus depolarized Δψ was presented as bar graph (ii). The bars represent the mean±S.E. (n=3). (c) Mitochondria were stained with MitoTracker Deep Red and MitoTracker Green FM simultaneously, and the staining intensities were determined by flow cytometry (i and ii), with the mean fluorescence presented in the bar graph (iii). The bars represent the mean±S.E. (n=3). (d) HCT116 cells were treated with propionate (3 mM) in the absence or presence of cyclosporin A (CsA, 2 μM) for 24 h. Then the cells were stained with calcein-AM, CoCl2 and MitoTracker Red. Representative images were obtained by fluorescence microscopy. Magnification, × 600. (e) Propionate treated cells were stained with MitoTracker Deep Red and calcein-AM. The staining intensities were analyzed by flow cytometry (i) and were presented as bar graph (ii). The bars represent the mean±S.E. (n=3). (f) HCT116 cells were treated with propionate (3 mM) in the presence or absence of N-acetylcysteine (NAC) (1 mM) for 24 h and the cells were stained with Carboxy-H2DCFDA for ROS detection and representative images were obtained by fluorescence microscopy. Magnification, × 100. (g) Carboxy-DCF fluorescence was analyzed by flow cytometry. (h) HCT116 cells were treated with propionate (0, 1, 3, 10 mM) for 48 h. The cells were stained with Carboxy-H2DCFDA and MitoTracker Deep Red. The fluorescence intensities were analyzed by flow cytometry. The percentage of cells with enhanced Carboxy-H2DCFDA and reduced MitoTracker Deep Red staining were presented as bar graph. The bars represent the mean±S.E. (n=3)
Depletion of energy sources or defective cellular energy generation would cause ATP depletion. Therefore, we next investigated whether the reduced cellular ATP during propionate treatment is achieved through reduced mitochondria mass, impaired mitochondria functionality or both. Propionate led to depolarization of mitochondrial membrane as reflected by increased numbers of JC-1 stained cells, with reduced JC-1 fluorescence in the lower red fluorescence signal intensity (FL-2 axis) (Figure 4bi). In addition to JC-1, we also used MitoTracker Deep Red, which stains mitochondria in live cells and accumulates in proportion to the membrane potential, to monitor Δψ. Flow cytometry allowed identification of two populations of cells with distinct MitoTracker Deep Red staining intensities (Figure 4ci and ii). The proportion of mitochondria with the lower florescence intensity, which reflected the depolarized mitochondria, was increased by propionate in a dose-and time-dependent manner (Figure 4ciii).
The loss of Δψ may be caused by increased mitochondrial membrane permeability transition (MPT).22 To test whether an induction of MPT was involved with propionate-mediated reduction in Δψ, HCT116 cells were treated with propionate and the MPT was analyzed using an established method involving fluorescence staining with MitoTracker Deep Red, calcein-AM and CoCl2. As shown in Figure 4d, calcein was retained in untreated cells and colocalized with MitoTracker Deep Red-labeled mitochondria. However, propionate treatment led to loss of mitochondrial calcein fluorescence, which was due to calcein leakage from the mitochondria and was quenched by the subsequent addition of CoCl2. In addition, reduced calcein fluorescence was associated with a concurrent reduction in MitoTracker deep red signals (Figure 4ei), suggesting that the loss of Δψ was observed subsequent to continuous pore activation. The induction of MPT was partially blocked by cyclosporine A (Figure 4e). Altogether, these data suggest that the loss of Δψ was associated with induction of MPT by propionate treatment.
Elevated reactive oxygen species (ROS) generation has been reported following MPT induction.23 In fact, the fermentation products of Propionibacterium, propionate and acetate have been identified to enhance ROS generation in human colorectal carcinoma cell lines.24 Following propionate treatment, the percentage of cells positively stained for carboxy-DCF was increased (Figure 4f and g), which was attenuated on adding the antioxidant N-acetylcysteine (NAC). We also noticed that the cells positively stained with carboxy-DCF were those with impaired mitochondria membrane potential as reflected by reduced MitoTracker Red staining (Figure 4h). The observations suggest that the source of ROS production during propionate treatment is likely originated from defective mitochondria. In addition to increased AMP/ATP ratio, ROS serve as signaling molecules to activate AMPK.25 The excessive ROS production has been suggested to have a role in the initiation of autophagy.26 Hence, the anti-oxidative effect of NAC on propionate-mediated autophagy was examined. Antioxidant agent NAC inhibited the propionate-induced ROS accumulation (Figure 4f and g) and attenuated the autophagy induction subsequently (Supplementary Figure S5c), providing evidence that ROS might contribute to the onset of autophagy. Cyclosporin A, which could attenuated MPT and reduced the release of ROS (data not shown), was also able to alleviate propionate triggered ROS accumulation and subsequent autophagy responses (Supplementary Figure S5c). We were, however, unable to completely prevent the autophagic response by NAC or cyclosporin A, suggesting that ROS-independent autophagy was also being induced by propionate.
Malfunctioning mitochondria is selectively targeted for autophagic degradation. Because of this, we suspected whether an alternative possibility for reduced cellular ATP production is due to reduced mitochondrial mass. We used MitoTracker Green FM, which localizes to mitochondria regardless of Δψ, to measure mitochondrial mass. A slight increase in MitoTracker Green fluorescence was detected 12 h after propionate exposure (Figure 4c). Taken together, the findings suggest that the decline in intracellular ATP during propionate treatment be attributed to the loss of Δψ rather than to a decrease in mitochondrial mass.
Defective mitochondria are targeted for autophagic degradation
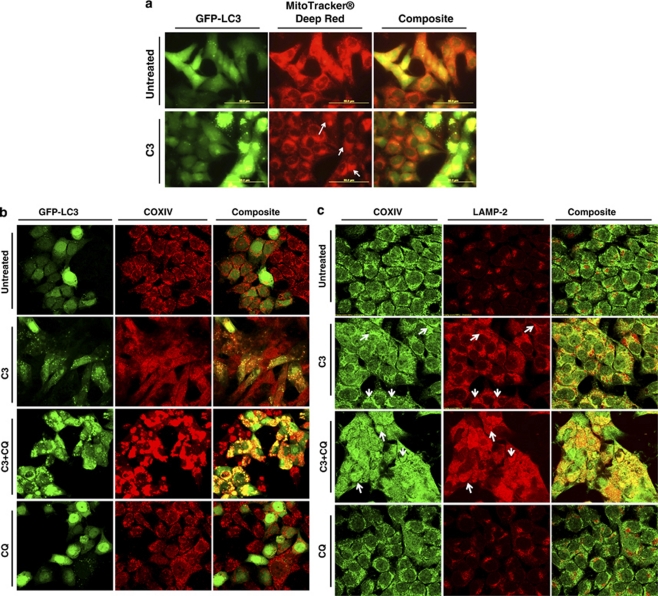
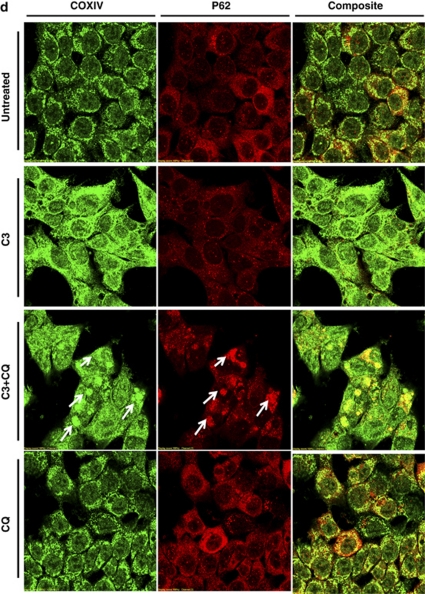
Autophagic degradation selectively targets depolarized mitochondria for digestion and elimination, a specific process termed ‘mitophagy', purpose of which is to rid the cell of damaged mitochondria and help prevent the activation of apoptotic pathways.27 As demonstrated in Figure 5a, in untreated cells we observed the existence of a punctate mitochondrial distribution. However, in HCT116 cells undergoing propionate-induced autophagy, we observed smeared mitochondrial staining with dramatically reduced staining intensity and increased colocalization between mitochondria and punctate GFP-LC3. Propionate increased colocalization between punctuate GFP-LC3 and mitochondria was also confirmed by the staining of COXIV (Figure 5b). The autolysosomes localized defective mitochondria were also supported by increased colocalization between COXIV and LAMP-2 (Figure 5c). Increased colocalization between COXIV and an ubiquitin-binding protein-p62, which interacts with LC3 and regulates autophagosome formation, was also observed (Figure 5d). Blockage of autophagic degradation by CQ resulted in an accumulation of mitochondrial aggregates, which overlap with LAMP-2 and p62 aggregates.
Figure 5.
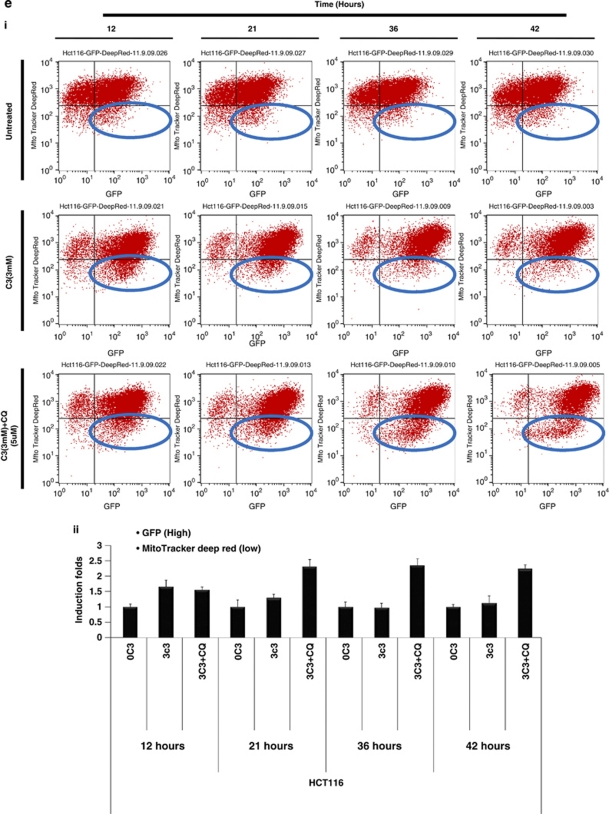
Defective mitochondria are targeted for autophagic degradation. (a) HCT116 cells with stable GFP-LC3 expression were treated with propionate (3 mM) or vehicle control (PBS) for 24 h. Mitochondria were stained by MitoTracker Deep Red, and representative images were obtained by fluorescence microscopy. Magnification, × 600. Arrows indicate the cells with autophagy induction by propionate. Note the smeared mitochondria staining in the cells with autophagy activation, which is reflected by the formation of GFP-LC3 dots. Yellow in the merged image indicates colocalization of GFP-LC3 with mitochondria. The treated cells were also stained with COXIV antibody (b) for mitophagy detection with a confocal microscope. HCT116 cells were treated with propionate (3 mM) in the presence or absence of CQ (5 μM) for 48 h. The cells were stained with COXIV/LAMP2 (c) or COXIV/p62 (d) antibodies. Representative images were obtained with an Olympus Fluoview confocal microscope using a × 60 oil immersion objective lens. HCT116 cells with stable GFP-LC3 expression were treated with propionate (3 mM) in the presence or absence of CQ (5 μM) for the indicated times. The GFP-LC3 and MitoTracker Deep Red fluorescence were analyzed by flow cytometry (ei) and the proportion of cells with increased GFP fluorescence and reduced MitoTracker Deep Red staining was presented as bar graph (eii). The bars represent the mean±S.E. (n=4). Arrows indicate the cells with autophagy induction by propionate
Propionate triggered mitophagy was supported by flow cytometry analysis which showed that the proportion of cells with reduced MitoTracker Deep Red staining and enhanced GFP-LC3 fluorescence was increased significantly following propionate treatment (Figure 5di). Termination of autophagic degradation by CQ dramatically increased the accumulation of defective mitochondria (Figure 5dii). The findings indicate that mitophagy selectively targets mitochondria with a depolarized membrane potential.
Rescue of cellular energy crisis through mitochondria biogenesis and alteration of glycogen and lipid metabolic pathways
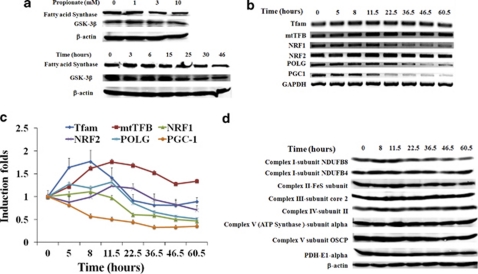
AMPK provides a finely tuned amplification mechanism for energy homeostasis under conditions of low nutrient availability by downregulating ATP-consuming anabolic pathways and upregulating ATP-producing catabolic pathways.28 In this way, AMPK activation could restore cellular energy homeostasis. In this study, propionate reduced the expression of fatty acid synthase (Figure 6a), which stores energy by catalyzing the synthesis of long-chain fatty acids (LCFAs) from acetyl-CoA and malonyl-CoA. We also found that GSK-3β, which inhibits endergonic glycogen synthesis by phosphorylation and inactivation of glycogen synthase, was downregulated (Figure 6a). Furthermore, inactivation of ACC by AMPK-mediated phosphorylation (Figure 3b), potentially inhibits de novo lipid synthesis, whereas inactivated ACC increases the mitochondrial import and oxidation of LCFAs, resulting in the generation of ATP.29
Figure 6.
Rescue of cellular energy crisis through mitochondria biogenesis and alteration of glycogen and lipid metabolic pathways. (a) HCT116 cells were treated with propionate at different concentrations for 24 h (top) or with 3 mM propionate for the indicated times (bottom). The expression level of fatty acid synthase and GSK-3β was determined by western blot. The expression profile of genes regulating mitochondrial biogenesis in HCT116 cells after propionate treatment was evaluated by both semiquantitative reverse transcriptase PCR (RT-PCR) (b) and Real-time PCR (c). The bars represent the mean±S.E. (n=4). Nuclear gene mitochondrial transcription factor A (Tfam); mitochondrial transcription factor B (mtTFB); nuclear respiratory factors-1 and 2 (NRF-1 and -2); DNA polymerase gamma (Pol-γ); and peroxisome proliferator activated receptor-γ co-activator 1 (PGC-1). (d) The protein level of mitochondrial redox carriers' subunits was examined by western blot
Energy deprivation stimulates mitochondrial biogenesis in skeletal muscle in an AMPK-dependent manner.30 We examined several mitochondrial biogenesis markers that are pivotal in coordinating transactivation genes for OXPHOS protein expression/importation, and heme biosynthesis in HCT116 cells after propionate treatment. As depicted in Figure 6b and c, propionate stimulated Tfam and mtTFB expression at the mRNA level, peaking at 8.5 and 11.5 h, respectively, followed by a return to pre-stimulatory levels. Coordinately, NRF-1 and -2 and pol-γ expression at the mRNA level were also stimulated as early as 12 h after treatment but were reduced after long-term treatment. Although the relative increase in mRNA content differed among the various transcription factors, a similar overall trend was observed with rapid induction upon propionate exposure. In contrast to the upregulation of these genes, we observed a time-dependent reduction in PGC-1 transcription (Figure 6b and c).
To ascertain whether mitochondrial biogenesis was truly induced, we examined the protein level of the mitochondrial redox carriers' subunits. The expression of a number of complex subunits located on the mitochondrial membrane was increased 8 h posttreatment, followed by a return to pre-stimulatory levels after 20 h (Figure 6d). The stimulation of mitochondrial biogenesis was also substantiated by an increase in MitoTracker Green FM fluorescence shown in Figure 4c. Altogether, the data suggest that HCT116 cells adapted to propionate-induced ATP depletion by downregulating anabolic processes such as glycogen and lipid synthesis, whereas stimulating mitochondrial biogenesis in attempt to resume cellular energy homeostasis.
Inhibition of autophagy potentiates propionate-induced apoptotic cell death
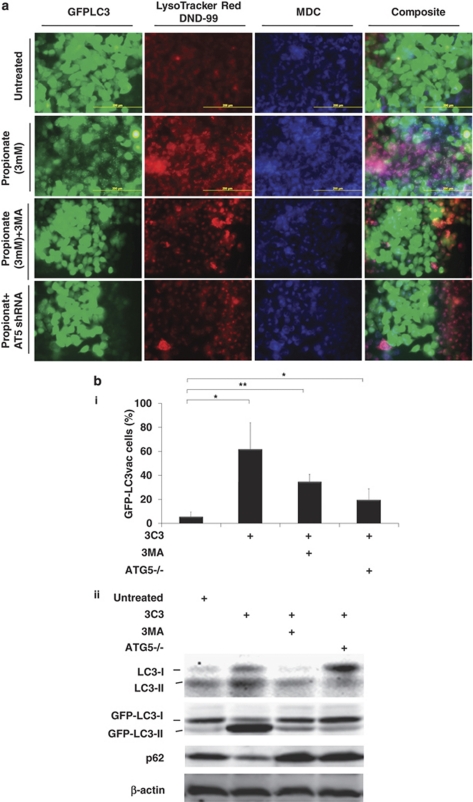
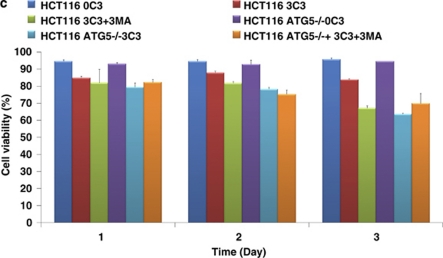
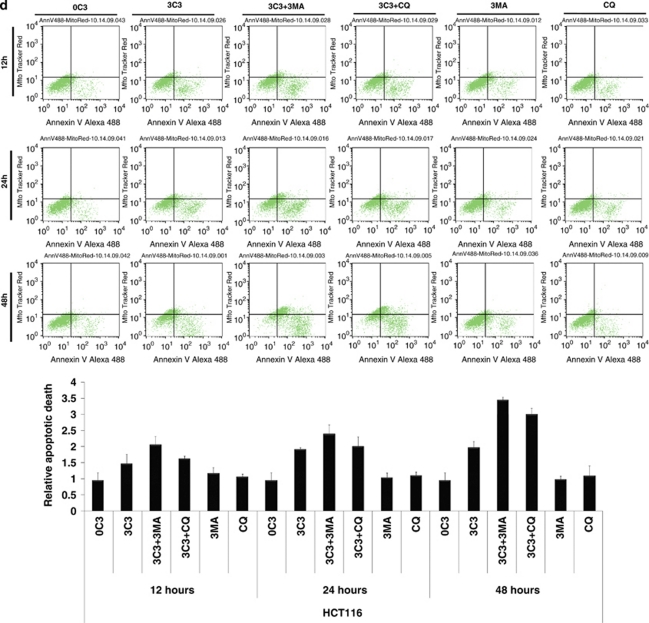
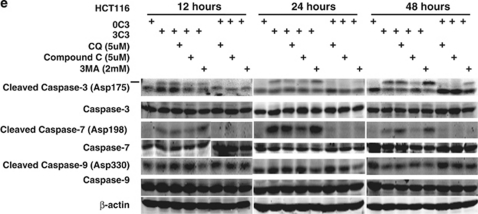
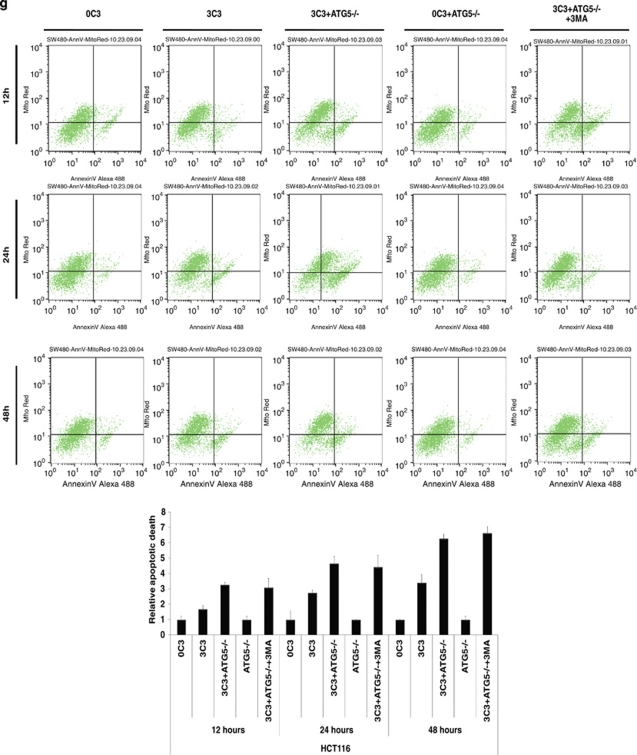
SCFAs possess antitumor activities by inducing caspase-3-mediated apoptosis.11 To determine the interconnection between propionate-induced autophagy and apoptosis, autophagy inhibitors were applied to examine the cell viability of HCT116 and SW480 cells during propionate treatment. The punctate GFP-LC3 formation observed in the cells treated with propionate was significantly reduced in cells pretreated with 3-MA at 2 mM (Figure 7a and b). At 24 and 48 h, combined treatment with 3-MA significantly enhanced the cytotoxic effect of propionate (Figure 7c). At 12 h after the initiation of treatment, propionate/3-MA treatment resulted in a marked increase in annexin V-positive cancer cells (Figure 7d). This difference persisted at 48 h, when a 1.75-fold difference in the percentage of annexin V-positive tumor cells was observed. As an independent approach to reflect cancer cell apoptosis, immunoblots revealed increased cleavages of the proapoptotic caspase-7 and executioner caspase-3, which are critical mediators of the mitochondrial events of apoptosis,31 in cancer cell lysates obtained 24 h after the initiation of propionate/3-MA treatment compared with those treated with propionate alone (Figure 7e). Prevention of autophagic degradation by adding chloroquine also enhanced apoptosis of HCT116 cells, especially at the later stage of treatment (48 h) (Figure 7d and e). In addition, to substantiate the role of AMPK in propionate-triggered autophagy, we investigated whether shRNA-mediated AMPKα silencing could resemble the effects of autophagy inhibition on propionate cytotoxicity. The shRNA-mediated downregulation of AMPKα augmented the propionate toxicity toward HCT116 cells, as demonstrated by a decrease in cell viability (Supplementary Figure S6d). Altogether, these results suggest that autophagic response has a protective role in impeding the propionate-elicited death of colon cancer cells.
Figure 7.
Inhibition of autophagy potentiates propionate-induced apoptotic cell death. (a) HCT116 cells were treated with propionate (3 mM) for 36 h in the absence or presence of 3-MA (2 mM). The same treatment was applied to the cells infected with ATG5 shRNA. Acidic vesicular organelle formation was detected by LysoTracker Red DND-99 and MDC staining. Representative images are all taken at × 600 magnification with a florescence microscope. (b) Punctate GFP-LC3 marked autophagosome formation was quantified (i). Data were presented as ‘GFP-LC3vac cells (%)' (bi). *P< 0.05; **P<0.001, compared with a PBS control. Several autophagy markers were evaluated by western blot (ii). HCT116 cells pretreated with 3-MA (2 mM) or infected with ATG5 shRNA were subjected to propionate (3 mM) for the indicated times. The cell viability was measured by trypan blue exclusion-based cell staining (c), and the apoptotic cell death was evaluated by phosphatidylserine (PS)-based annexin V staining (d, g). (e) Western blot analyses of caspase-7 and caspase-3 cleavage in HCT116 cells treated with propionate (3 mM) for the indicated times in the absence or presence of autophagy inhibitors (3-MA and CQ) or AMPK inhibitor (Compound C). (f) HCT116 and SW480 cells were infected with ATG5 shRNA, and the protein knockdown was evaluated by western blot
To further verify the protective role of autophagy against propionate-induced death, autophagy was suppressed through knockdown of ATG5. Decreased ATG5 expression in cells transduced with shRNA against ATG5 was confirmed by western blot (Figure 7f). ATG5 depletion reduced the ability of propionate to induce GFP-LC3 punctae formation (Figure 7a and b) and potentiated its effectiveness in the induction of cell death (Figure 7c and g). Inhibited autophagy responses, enhanced-cell death and caspase-3/7 cleavage were also observed in the HCT116 cells with decreased ATG7 expression by the RNA interference (Supplementary Figure S6a, b and c). Autophagy inhibition by either a pharmacological (3-MA or CQ) or genetic (ATG5 shRNA) approach also potentiated propionate-triggered apoptosis in SW480 cells (Supplementary Figure S6e, f, and g).
3-MA and CQ at higher dosage may have detrimental side effects on tumor cell viability apart from inhibiting autophagy. To confirm the antineoplastic effect of 3MA and CQ depends on their ability to inhibit autophagy-based survival, propionate/3MA or propionate/CQ treatment of cancer cells was compared with those in which autophagy was genetically inhibited using shRNA against ATG5 (shATG5). Co-treatment of 3MA or CQ did not further enhance cell death following propionate exposure in cells with ATG5 knockdown, as shown in Figure 7c and g and Supplementary Figure S6e and f. Hence, the ability of 3-MA and CQ to potentiate propionate-induced cell death is based on their inhibition of autophagy.
Discussion
The antitumor activities of SCFAs, especially butyrate, in colon cancer have been extensively studied.32 The data presented here demonstrate the autophagy is induced by propionate. Autophagy serves as an adaptive response as cotreatment with autophagy inhibitors or expression of shRNA directed against ATG5/7 augmented propionate-induced cell death. Our data suggest that autophagy is an adaptive strategy allowing for augmented resistance to apoptotic stimuli triggered by SCFAs in colon cancer cells.
Autophagy is activated in response to various stress stimuli, including starvation, hypoxia, endoplasmic reticulum stress and oxidative stress. In this study, autophagy induction was dependent on downregulation of its negative regulator mTOR, inactivation of which was linked to hyper-phosphorylation of the AMPKα. In addition to increased AMP/ATP ratio, ROS serve as signaling molecules to activate AMPK.25 In this study, the ATP depletion and ROS accumulation may jointly initiate AMPK activation. SCFAs are oxidized through β-oxidation to provide an alternative energy source for colonocytes, which may account for the transient ATP upregulation (1–7 h). Subsequently, a drop of cellular ATP occurred (after 7 h), which preceded the initiation of the extensive mitochondria membrane potential loss (12 h) (Figure 4cii). The observed early-stage (7–12 h) ATP depletion might be explained by the enhanced ATP consumption due to increased Na+/HCO3 cotransporter (NBC) and the Na+/H+ exchanger (NHE) activities after SCFAs treatment.12 Through autophagic degradation of cellular organelles and cytoplasmic content, autophagy enables the cells to recycle amino acids and nutrients to maintain protein synthesis and ATP generation, thereby sustaining bioenergetic homeostasis and cell survival.33 The direct evidence addressing the role of autophagy in ATP recovery is that abrogation of autophagy induction by ATG5 knockdown or blockage of autophagic degradation by CQ precipitated propionate-induced ATP depletion (Supplementary Figure S7 and 5). On the basis of these results, we reasoned that autophagy induced in response to propionate might provide the tumor cell with an alternative source of metabolic requirements to allow for adaptive protein synthesis and help overcome the cellular energy crisis caused by mitochondrial defects.
Autophagy promotes cell survival, not only by recycling cellular constituents to sustain bioenergetics, but also functions as a cytoplasmic quality control mechanism by liquidating damaged organelles and protein aggregates, whose accumulation following cellular stress can be cytotoxic.34 Autophagy also assumes an increasingly recognized role in cellular homeostasis control during hypoxia by removing mitochondria that might otherwise become cytotoxic.35 In this study, flow cytometry analysis provided strong evidence suggesting a correlation between MPT induction, loss of Δψ (Figure 4), increased ROS generation (Supplementary Figure S8) and autophagy targeting malfunctioning mitochondrial degradation in that propionate induced a loss of Δψ (Figures 4 and 5). These results emphasize the role of the mitochondrial depolarization as a key event in mitochondrial autophagy and strengthen the idea that the mitochondrial permeability transition is a determinant of mitophagy. As two mechanistically distinct programmed cell deaths, autophagy and apoptosis can be induced simultaneously, sequentially, or in a mutually exclusive manner in response to cellular stresses.36, 37 Mitochondria may be central organelles integrating the two types of cell death in which the mitochondrial permeability transition has been proposed to designate the cell's destiny by adopting either autophagy or apoptosis.38 Autophagic degradation of defective mitochondria could retard the occurrence of apoptosis by circumventing the release of proapoptotic factors, which impedes the activation of the apoptotic cascade.
Propionate and butyrate have been reported to have histone deacetylase (HDAC) inhibition activities.39 Treatment of the cells with Trichostatin A (TSA), a well-known histone deacetylase inhibitor, failed to mimic the propionate-induced autophagic responses (Supplementary FigureS9).
The link between diet and cancer is complex and difficult to unravel. The relevance of SCFAs, the major bacterial fermentation product of fibers, to cancer is manifold. SCFAs have been reported as antitumor agents that selectively induce differentiation, growth arrest and apoptosis in colon cancer cells.3, 13, 32 The results presented suggest that spontaneously-induced autophagy by SCFAs would increase the resistance and flexibility of colon cancer toward an adverse microenvironment and compromise the efficacy of SCFAs themselves in colon cancer prevention. Although we have yet to examine SCFAs/chloroquine combination therapy in vivo, chloroquine has emerged as an anticancer autophagy modulator in a number of in vivo models. Perhaps most important is the fact that our study provides a proof of principle for enhancing the antitumor activities of SCFAs by modulation of autophagic pathways. Combination regimens including CQ or drugs targeting other steps in the autophagy pathway with high-fiber containing food may be a feasible and promising therapeutic option for colon cancer treatment.
Materials and Methods
Materials
Human colon carcinoma cell lines HCT116 and SW480 were purchased from American Type Culture Collection. The 293T and phoenix Ampho packaging cell line were from Orbigen (San Diego, CA, USA). Fetal bovine serum (FBS) was purchased from Invitrogen Corporation (Carlsbad, CA, USA). Mouse anti-PI3-Kinase was purchased from BD Transduction Laboratories (Sparks, MD, USA). AMPK beta-1 Phospho (pS181) and AMPK gamma-1 (C-terminal) rabbit monoclonal antibody were purchased from Epitomics Inc. (Burlingame, CA, USA). LC3 rabbit polyclonal antibody was kindly given by Dr. Jayanta Debnath. p62/SQSTM1, ATG7 and LAMP-2 antibody were purchased from Santa Cruz Biotechnology, Inc. (Santa Cruz, CA, USA). Total OXPHOS human antibody cocktail (MS601) and MitoProfile total OXPHOS+PDH ICC antibody kit (MS602) were purchased from MitoSciences Inc. (Eugene, OR, USA). β-actin was purchased from Sigma-Aldrich (St. Louis, MO, USA). All other antibodies were purchased from Cell Signaling Technology, Inc. (Danvers, MA, USA). Sodium propionate, sodium butyrate, Monodansylcadervarine (MDC), Chloroquine, N-acetylcysteine (NAC), Compound C and 3-Methyladenine (3-MA) were purchased from Sigma-Aldrich. The regular PCR reagents and MTS solution were from Promega Corporation (Madison, WI, USA). DNAfectin liposome transfection reagent was purchased from Applied Biological Materials Inc. (Richmond, BC, Canada). Microtubule-associated protein light-chain 3 (GFP-LC3) retrovirus expression construct, was kindly given by Dr. Jayanta Debnath from the University of California, San Franscisco, CA, USA. Four HuSH 29mer shRNA constructs against human ATG5 (Locus ID=9474), with sequences listed in Table 1, were purchased from OriGene Technologies (Rockville, MD, USA). Four pGIPZ lentiviral shRNA constructs against human ATG7 and four pTRIPZ lentiviral shRNA constructs against human AMP, alpha 1 catalytic subunit (PRKAA1) were purchased from Open Biosystems Products (Huntsville, AL, USA). LysoTracker Red DND-99, MitoTracker Deep Red FM, MitoTracker Green FM, ROS Detection Reagent (carboxy-H2DCFDA), Vybrant Apoptosis Assay Kit (V35116) with Alexa Fluor 488 annexin V, MitoTracker Red dye and MitoProbe Transition Pore Assay Kit (M34153) were purchased from Invitrogen.
Table 1. ATG5 shRNA constructs sequence.
| ATG5 shRNA constructs | Sequence (5′–3′) |
|---|---|
| TI358433 | GTGCTTCGAGATGTGTGGTTTGGACGAAT |
| TI358435 | AAGCACTTTCAGAAGGTTATGAGACAAGA |
| TI358434 | TCAGCTCTTCCTTGGAACATCACAGTACA |
| TI358436 | GCAATCTTGTAACTTTGATAATGAACAGT |
Cell culture and transfection
HCT116 cells were grown in a RPMI 1640 medium supplemented with 10% FBS and Antibiotics–Antimycotics (100 units/ml penicillin, 100 μg/ml streptomycin and 250 μg/ml amphotericin B) in a humidified incubator under an atmosphere containing 5% CO2 at 37°C. Phoenix Ampho cells were grown in DMEM medium with 10% FBS and Antibiotics–Antimycotics. All cell lines were tested negative for mycoplasma contamination. MAP1LC3 (LC3), one of the mammalian homologs of yeast ATG8, is a well-established marker of autophagosome formation. A retroviral vector (pBABE) was used to generate cell lines stably expressing GFP-LC3. For this viral infection, approximately 10 million Phoenix Ampho cells were transfected with the plasmid by using DNAfectin liposome transfection reagent. Viral supernatants were collected 48 h after transfection, diluted 1:1 in fresh medium in the presence of polybrene (4 μg/ml) and added to HCT116 and SW480 cells seeded in six-well plates at 30% confluence. After 24 h at 37°C, the viral supernatant was replaced with a fresh aliquot. Three sequential rounds of infection were performed for each condition, after which more than 90% of the cells expressed the exogenous proteins. Generation of HCT116 and SW480 cells with ATG5 knockdown by shRNA was performed according to the protocol described above. Regarding to ATG7 pGIPZ lentiviral shRNA and AMPKα pTRIPZ lentiviral shRNA generations, 293T cells were transfected with ATG7 shRNA or AMPKα constructs in the presence of packaging plasmids. The virus collection and target cells infection follow the same protocol above. HCT116 cells with ATG7 pGIPZ lentiviral shRNA expression are marked by TurboGFP. HCT116 cells with AMPα pTRIPZ lentiviral shRNA expression are marked by TurboRFP and regulated by a Tet-On or Tet-Off system.
Western blotting
HCT116 and SW480 cells after treatments were collected with ice-cold RIPA Buffer (Sigma-Aldrich, R0278) in the presence of a protease inhibitor cocktail (Sigma-Aldrich, S8830). A volume of 50 μg of protein was fractionated by SDS-PAGE gels in a Bio-Rad Protean II system (Bio-Rad Laboratories, Hercules, CA, USA). After transferring proteins to a PVDF membrane, the membrane was blocked with Odyssey Blocking Buffer from LI-COR Biosciences (Lincoln, NE, USA) for 60 min at room temperature and incubated with the primary antibody at appropriate dilutions in Odyssey Blocking Buffer at 4°C overnight. After overnight incubation with appropriate primary antibodies, the membrane was washed (3 × ) with TBS-T for a total of 15 min, probed with fluorescently-labeled secondary antibody (1:5000) for 80 min at room temperature and washed (3 × ) with TBS-T for a total of 15 min. The immunoblots were visualized by an Odyssey Infrared Imaging System (LI-COR Biosciences).
Labeling of acidic compartments with LysoTracker and MDC
LysoTracker Red DND-99 has been widely used as a probe to indicate autophagic activity in a variety of organisms. In brief, acidic vesicular organelles (AVO) were labeled with the dye (50 nM, Molecular Probes Invitrogen Corporation) diluted in prewarmed (37°C) RPMI 1640 medium for 15 min at 37°C. After incubation, the cells were rinsed once with serum-free medium and immediately observed with a BX41 fluorescence microscope (Olympus, Center Valley, PA, USA). A total of 20 000 cells per sample were determined by flow cytometry (excitation wavelength 488 nm, emission filter 585/42 nm) using a FACS Calibur system. MDC has been reported to be a specific marker to label autophagic vacuoles. In brief, the cells were incubated with 0.05 mM MDC in PBS at 37°C for 10 min. After incubation, the cells were washed twice with PBS and intracellular MDC was visualized with a BX41 system microscope. A total of 20 000 cells per sample were processed for flow cytometry (excitation wavelength 351–364 nm, emission filter 485/22 nm) using a FACS Vantage system.
ATP quantitation
ATP was quantitated with a CellTiter-Glo Luminescent Cell Viability Assay kit (Promega Corporation). Luminescence was measured by Luminoskan Ascent from Thermo Scientific.
Quantitation of AMP, ADP and ATP by HPLC
A volume of 700 μl of 0.4 M perchloric acid and internal control were added into HCT116 cells after treatments. Cells were then frozen, thawn and centrifuged. The pellets were used for protein measurements. The supernatant was neutralized with 1/10 volume of 4M K2CO3 and then centrifuged again. Supernatants were used for HPLC analysis. The HPLC analyses of AMP, ADP and ATP were performed on a Shimadzu LC-20AT HPLC system equipped with a Thermo scientific hypersil gold column (4.6 × 150 mm, 3 μm) preceded by a C18 precolumn cartridge. The solvent system comprised two buffers at a rate of 0.5 ml/min using an isocratic elution: 38% buffer B (V/V). Buffer A contained 25 mM NaH2PO4, 0.01% tetrabutylammonium hydroxide, pH 5. Buffer B was composed of 10% (V/V) acetonitrile in 200 mM NaH2PO4, 0.01% tetrabutylammonium hydroxide, pH 4.0. The compounds were detected by monitoring of UV absorbance at 254 nm, and they were quantified by comparison of peak areas to a standard curve. Protein measurements were performed using a BCA kit. Calculations were performed by peakheight calibrations and values were expressed as micromoles per gram wet weight or nanomoles per milligram of protein.
Flow cytometry for mitochondrial membrane potential detection
The mitochondrial membrane potential (Δψ) of HCT116 cells after propionate treatment was measured using a Flow Cytometry Mitochondrial Membrane Potential Detection Kit (BD Biosciences). Fluorescence emission was analyzed by flow cytometry (JC-1monomers: excitation wavelength 488 nm, emission filter 530/30 nm; JC-1 aggregates: excitation wavelength 488 nm, emission filter 585/42 nm) using a FACS Calibur system. The Δψ was also quantified by microscopic examination of cells stained with MitoTracker Deep Red FM and confirmed by flow cytometry analysis. In brief, the cell medium was aspirated after treatment, and MitoTracker Deep Red FM (100 nM in RPMI without FBS) was added for 15 min at 37°C. The fluorescence emission was either detected under microscope or analyzed by flow cytometry (excitation wavelength 635 nm, emission filter 661/16 nm).
Immunocytochemistry and confocal microscopy
HCT116 cells were seeded at 0.3 × 10⁶/well into six-well plates with coverglasses to achieve 70% confluence. After 36 h, the cells were treated with propionate (3 mM) in the presence or absence of CQ (5 μM) for 48 h. The cells were fixed with 3% paraformaldehyde in PBS for 15 min, followed by permeabilization with 0.1% Triton X-100 for 5 min. After blocking in 3% BSA/1 × PBS containing 3% horse serum for 40 min, the slides were incubated with COXIV/p62 or COXIV/LAMP2 antibodies at 4°C overnight. After overnight incubation, the slides were washed three times with PBS and then incubated with Alexa Fluor 568 goat anti-mouse IgG (H+L) and Alexa Fluor 488 goat anti-rabbit IgG (H+L) secondary antibody for 1.5 h (1:100 dilution). The slides were then washed three times with PBS, counterstained in Prolong Gold antifade reagent with DAPI and visualized with an Olympus Fluoview confocal microscope using a × 60 oil immersion objective lens (IX70 Olympus, Melville, NY, USA). Fluorescence was excited by the 488-nm line of an argon laser and the 568/647-nm line of a Krypton laser. Images were analyzed using Fluoview software (Olympus Imaging America Inc., Center Valley, PA, USA).
Staining and flow cytometry analysis of mitochondrial mass, ROS and MPT
Mitochondrial mass was measured by MitoTracker Green FM. Mitochondrion staining by MitoTracker Green FM follows the same protocol as to MitoTracker Deep Red FM staining. The fluorescence emission was detected by flow cytometry (excitation wavelength 488 nm, emission filter 530/30 nm). ROS was measured using an Image-iT LIVE Green Reactive Oxygen Species Detection Kit (Molecular Probes, I36007). In brief, the cells were treated with propionate at various concentrations and incubated with carboxy-H2DCFDA (25 μM in Hank's balanced salt solution) for 30 min at 37°C, protected from light. DCF fluorescence was measured with a FACS Calibur flowcytometry system (excitation wavelength 488 nm, emission filter 530/30 nm). A MitoProbe Transition Pore Assay Kit was used for mitochondrial membrane permeability transition (MPT) detection. In brief, the cells were treated with propionate at various concentrations and incubated with calcein-AM (10 nM) and CoCl2 (0.4 mM) for 15 min at 37°. After washing with PBS, calcein-AM fluorescence was either examined under a fluorescence microscope or measured with a FACS Calibur flow cytometry system (excitation wavelength 488 nm, emission filter 530 nm).
RT-PCR and real-time PCR
The expression profile of genes regulating mitochondrial biogenesis was evaluated by semiquantitative reverse transcriptase PCR (RT-PCR) and Real-time quantitative PCR. Genes of interest were amplified by PCR from cDNA with the primer pairs listed in Table 2. The reactions were performed as described by Chen et al.40
Table 2. RT-PCR primer sequences.
|
RT-PCR primer sequences | ||
|---|---|---|
| Gene | Sequence (5′–3′) | Size (bp) |
| Tfam | Sense CCACCGGAGCGATGGCGTTT | 112 |
| Antisense CTGAAGGGGGAGCGCAGTCG | ||
| mtTFB | Sense CGTGGGCGTGGTGCACTTCA | 169 |
| Antisense CAGCCTGCCCGTGCTTTCCA | ||
| NRF1 | Sense GCGCAGCCGCTCTGAGAACT | 269 |
| Antisense CAGCAGCGGCCATTCCCACA | ||
| NRF2 | Sense GGCTGCTGCACTGGAAGGCT | 216 |
| Antisense TCTCCCCGAGGAACCCGCTG | ||
| POLG | Sense ACCGGGAAGCACCGTGAGGA | 197 |
| Antisense GCAGGCGGCTCATGGTTGGT | ||
| PGC1 | Sense GCCGTGGCCGCAGAAATGAC | 578 |
| Antisense GCCTGTGGCATCCGCCCAAA | ||
| hGADPH | Sense GGCCTCCAAGGAGTAAGACC | 147 |
| Antisense AGGGGTCTACATGGCAACTG | ||
Cell viability and apoptotic cell death measurement
For the MTS assay, 0.5 × 10⁵ cells/well were plated in 96-well plates in RPMI medium, and the indicated drug treatments were applied 36 h after seeding. At 48 h, the MTS reagent supplied in CellTiter 96 AQueous Assay (Promega) was added. Cell viability was measured with Vi-CELL Series Cell Viability Analyzers (Beckman Coulter, Inc., Brea, CA, USA), which is based on traditional cell viability method of trypan blue exclusion. In addition, a Vybrant Apoptosis Assay Kit (V35116), which provides a rapid and convenient assay for apoptosis based on PS translocation and changes in Δψ, was used. MitoTracker Red and Alexa Fluor 488 annexin V fluorescence were measured with a FACS Calibur flowcytometry system (MitoTracker Red: excitation wavelength 488 nm, emission filter 585 nm; Alexa Fluor 488 annexin V: excitation wavelength 488 nm, emission filter 530 nm).
Statistics
The probability of statistically significant differences between two experimental groups was determined by Student's t-test. P <0.05 was considered statistically significant in all calculations.
Acknowledgments
We would like to thank Anna Travelstead for acquisition of flow cytometry data and Dr. Jayanta Debnath for giving the retrovirus based GFP-LC3 expression construct and LC3 antibody. We also would like to thank Gregory T. Robbins for his review and critical proofreading.
Glossary
- SCFAs
Short-chain fatty acids
- MDC
Monodansylcadervarine
- CQ
Chloroquine
- 3-MA
3-Methyladenine
- MPT
mitochondrial membrane permeability transition
- Δψ
mitochondrial membrane potential
- AVOs
acidic vesicular organelles
- LC3
microtubule-associated protein light chain 3
- ROS
reactive oxygen species
- NAC
N-acetylcysteine
- HPLC
high performance liquid chromatography
- DAPI
40-6-diamidino-2-phenylindole
- LAMP-2
lysosomal associated membrane protein 2
The authors declare no conflict of interest.
Footnotes
Supplementary Information accompanies the paper on Cell Death and Differentiation website (http://www.nature.com/cdd)
Edited by M Piacentini
Supplementary Material
References
- Cook SI, Sellin JH. Review article: short chain fatty acids in health and disease. Aliment Pharmacol Ther. 1998;12:499–507. doi: 10.1046/j.1365-2036.1998.00337.x. [DOI] [PubMed] [Google Scholar]
- Cummings JH. Colonic absorption: the importance of short chain fatty acids in man. Scand J Gastroenterol Suppl. 1984;93:89–99. [PubMed] [Google Scholar]
- Ruemmele FM, Dionne S, Qureshi I, Sarma DS, Levy E, Seidman EG. Butyrate mediates Caco-2 cell apoptosis via up-regulation of pro-apoptotic BAK and inducing caspase-3 mediated cleavage of poly-(ADP-ribose) polymerase (PARP) Cell Death Differ. 1999;6:729–735. doi: 10.1038/sj.cdd.4400545. [DOI] [PubMed] [Google Scholar]
- Trock B, Lanza E, Greenwald P. Dietary fiber, vegetables, and colon cancer: critical review and meta-analyses of the epidemiologic evidence. J Natl Cancer Inst. 1990;82:650–661. doi: 10.1093/jnci/82.8.650. [DOI] [PubMed] [Google Scholar]
- Klionsky DJ, Emr SD. Autophagy as a regulated pathway of cellular degradation. Science. 2000;290:1717–1721. doi: 10.1126/science.290.5497.1717. [DOI] [PMC free article] [PubMed] [Google Scholar]
- Seglen PO, Bohley P. Autophagy and other vacuolar protein degradation mechanisms. Experientia. 1992;48:158–172. doi: 10.1007/BF01923509. [DOI] [PubMed] [Google Scholar]
- Levine B, Klionsky DJ. Development by self-digestion: molecular mechanisms and biological functions of autophagy. Dev Cell. 2004;6:463–477. doi: 10.1016/s1534-5807(04)00099-1. [DOI] [PubMed] [Google Scholar]
- Kondo Y, Kanzawa T, Sawaya R, Kondo S. The role of autophagy in cancer development and response to therapy. Nat Rev Cancer. 2005;5:726–734. doi: 10.1038/nrc1692. [DOI] [PubMed] [Google Scholar]
- Amaravadi RK, Thompson CB. The roles of therapy-induced autophagy and necrosis in cancer treatment. Clin Cancer Res. 2007;13:7271–7279. doi: 10.1158/1078-0432.CCR-07-1595. [DOI] [PubMed] [Google Scholar]
- Degenhardt K, Mathew R, Beaudoin B, Bray K, Anderson D, Chen G, et al. Autophagy promotes tumor cell survival and restricts necrosis, inflammation, and tumorigenesis. Cancer Cell. 2006;10:51–64. doi: 10.1016/j.ccr.2006.06.001. [DOI] [PMC free article] [PubMed] [Google Scholar]
- Hague A, Elder DJ, Hicks DJ, Paraskeva C. Apoptosis in colorectal tumour cells: induction by the short chain fatty acids butyrate, propionate and acetate and by the bile salt deoxycholate. Int J Cancer. 1995;60:400–406. doi: 10.1002/ijc.2910600322. [DOI] [PubMed] [Google Scholar]
- Rodenburg W, Keijer J, Kramer E, Vink C, van der Meer R, Bovee-Oudenhoven IM. Impaired barrier function by dietary fructo-oligosaccharides (FOS) in rats is accompanied by increased colonic mitochondrial gene expression. BMC Genomics. 2008;9:144. doi: 10.1186/1471-2164-9-144. [DOI] [PMC free article] [PubMed] [Google Scholar]
- Heerdt BG, Houston MA, Augenlicht LH. Potentiation by specific short-chain fatty acids of differentiation and apoptosis in human colonic carcinoma cell lines. Cancer Res. 1994;54:3288–3293. [PubMed] [Google Scholar]
- Eskelinen EL, Illert AL, Tanaka Y, Schwarzmann G, Blanz J, Von Figura K, et al. Role of LAMP-2 in lysosome biogenesis and autophagy. Mol Biol Cell. 2002;13:3355–3368. doi: 10.1091/mbc.E02-02-0114. [DOI] [PMC free article] [PubMed] [Google Scholar]
- Mathew R, Karantza-Wadsworth V, White E. Role of autophagy in cancer. Nat Rev Cancer. 2007;7:961–967. doi: 10.1038/nrc2254. [DOI] [PMC free article] [PubMed] [Google Scholar]
- Inoki K, Zhu T, Guan KL. TSC2 mediates cellular energy response to control cell growth and survival. Cell. 2003;115:577–590. doi: 10.1016/s0092-8674(03)00929-2. [DOI] [PubMed] [Google Scholar]
- Pullen N, Thomas G. The modular phosphorylation and activation of p70s6k. FEBS Lett. 1997;410:78–82. doi: 10.1016/s0014-5793(97)00323-2. [DOI] [PubMed] [Google Scholar]
- Chiang GG, Abraham RT. Phosphorylation of mammalian target of rapamycin (mTOR) at Ser-2448 is mediated by p70S6 kinase. J Biol Chem. 2005;280:25485–25490. doi: 10.1074/jbc.M501707200. [DOI] [PubMed] [Google Scholar]
- Dennis PB, Jaeschke A, Saitoh M, Fowler B, Kozma SC, Thomas G. Mammalian TOR: a homeostatic ATP sensor. Science. 2001;294:1102–1105. doi: 10.1126/science.1063518. [DOI] [PubMed] [Google Scholar]
- Meley D, Bauvy C, Houben-Weerts JH, Dubbelhuis PF, Helmond MT, Codogno P, et al. AMP-activated protein kinase and the regulation of autophagic proteolysis. J Biol Chem. 2006;281:34870–34879. doi: 10.1074/jbc.M605488200. [DOI] [PubMed] [Google Scholar]
- Stein SC, Woods A, Jones NA, Davison MD, Carling D. The regulation of AMP-activated protein kinase by phosphorylation. Biochem J. 2000;345 (Part 3:437–443. [PMC free article] [PubMed] [Google Scholar]
- Ly JD, Grubb DR, Lawen A. The mitochondrial membrane potential (deltapsi(m)) in apoptosis; an update. Apoptosis. 2003;8:115–128. doi: 10.1023/a:1022945107762. [DOI] [PubMed] [Google Scholar]
- Kanno T, Sato EE, Muranaka S, Fujita H, Fujiwara T, Utsumi T, et al. Oxidative stress underlies the mechanism for Ca(2+)-induced permeability transition of mitochondria. Free Radic Res. 2004;38:27–35. doi: 10.1080/10715760310001626266. [DOI] [PubMed] [Google Scholar]
- Jan G, Belzacq AS, Haouzi D, Rouault A, Metivier D, Kroemer G, et al. Propionibacteria induce apoptosis of colorectal carcinoma cells via short-chain fatty acids acting on mitochondria. Cell Death Differ. 2002;9:179–188. doi: 10.1038/sj.cdd.4400935. [DOI] [PubMed] [Google Scholar]
- Emerling BM, Weinberg F, Snyder C, Burgess Z, Mutlu GM, Viollet B, et al. Hypoxic activation of AMPK is dependent on mitochondrial ROS but independent of an increase in AMP/ATP ratio. Free Radic Biol Med. 2009;46:1386–1391. doi: 10.1016/j.freeradbiomed.2009.02.019. [DOI] [PMC free article] [PubMed] [Google Scholar]
- Scherz-Shouval R, Shvets E, Fass E, Shorer H, Gil L, Elazar Z. Reactive oxygen species are essential for autophagy and specifically regulate the activity of Atg4. Embo J. 2007;26:1749–1760. doi: 10.1038/sj.emboj.7601623. [DOI] [PMC free article] [PubMed] [Google Scholar]
- Lemasters JJ. Selective mitochondrial autophagy, or mitophagy, as a targeted defense against oxidative stress, mitochondrial dysfunction, and aging. Rejuvenation Res. 2005;8:3–5. doi: 10.1089/rej.2005.8.3. [DOI] [PubMed] [Google Scholar]
- Rutter GA, Da Silva Xavier G, Leclerc I. Roles of 5′-AMP-activated protein kinase (AMPK) in mammalian glucose homoeostasis. Biochem J. 2003;375:1–16. doi: 10.1042/BJ20030048. [DOI] [PMC free article] [PubMed] [Google Scholar]
- McGarry JD. Banting lecture 2001: dysregulation of fatty acid metabolism in the etiology of type 2 diabetes. Diabetes. 2002;51:7–18. doi: 10.2337/diabetes.51.1.7. [DOI] [PubMed] [Google Scholar]
- Zong H, Ren JM, Young LH, Pypaert M, Mu J, Birnbaum MJ, et al. AMP kinase is required for mitochondrial biogenesis in skeletal muscle in response to chronic energy deprivation. Proc Natl Acad Sci USA. 2002;99:15983–15987. doi: 10.1073/pnas.252625599. [DOI] [PMC free article] [PubMed] [Google Scholar]
- Lakhani SA, Masud A, Kuida K, Porter GA, Jr, Booth CJ, Mehal WZ, et al. Caspases 3 and 7: key mediators of mitochondrial events of apoptosis. Science. 2006;311:847–851. doi: 10.1126/science.1115035. [DOI] [PMC free article] [PubMed] [Google Scholar]
- Medina V, Edmonds B, Young GP, James R, Appleton S, Zalewski PD. Induction of caspase-3 protease activity and apoptosis by butyrate and trichostatin A (inhibitors of histone deacetylase): dependence on protein synthesis and synergy with a mitochondrial/cytochrome c-dependent pathway. Cancer Res. 1997;57:3697–3707. [PubMed] [Google Scholar]
- Codogno P, Meijer AJ. Autophagy and signaling: their role in cell survival and cell death. Cell Death Differ. 2005;12 (Suppl 2:1509–1518. doi: 10.1038/sj.cdd.4401751. [DOI] [PubMed] [Google Scholar]
- Komatsu M, Waguri S, Chiba T, Murata S, Iwata J, Tanida I, et al. Loss of autophagy in the central nervous system causes neurodegeneration in mice. Nature. 2006;441:880–884. doi: 10.1038/nature04723. [DOI] [PubMed] [Google Scholar]
- Zhang H, Bosch-Marce M, Shimoda LA, Tan YS, Baek JH, Wesley JB, et al. Mitochondrial autophagy is an HIF-1-dependent adaptive metabolic response to hypoxia. J Biol Chem. 2008;283:10892–10903. doi: 10.1074/jbc.M800102200. [DOI] [PMC free article] [PubMed] [Google Scholar] [Retracted]
- Kanzawa T, Kondo Y, Ito H, Kondo S, Germano I. Induction of autophagic cell death in malignant glioma cells by arsenic trioxide. Cancer Res. 2003;63:2103–2108. [PubMed] [Google Scholar]
- Herman-Antosiewicz A, Johnson DE, Singh SV. Sulforaphane causes autophagy to inhibit release of cytochrome C and apoptosis in human prostate cancer cells. Cancer Res. 2006;66:5828–5835. doi: 10.1158/0008-5472.CAN-06-0139. [DOI] [PubMed] [Google Scholar]
- Rodriguez-Enriquez S, He L, Lemasters JJ. Role of mitochondrial permeability transition pores in mitochondrial autophagy. Int J Biochem Cell Biol. 2004;36:2463–2472. doi: 10.1016/j.biocel.2004.04.009. [DOI] [PubMed] [Google Scholar]
- Aoyama M, Kotani, Usami M. Butyrate and propionate induced activated or non-activated neutrophil apoptosis via HDAC inhibitor activity but without activating GPR-41/GPR-43 pathways. Nutrition. 2010;26:653–661. doi: 10.1016/j.nut.2009.07.006. [DOI] [PubMed] [Google Scholar]
- Chen Y, Tang Y, Wang MT, Zeng S, Nie D. Human pregnane X receptor and resistance to chemotherapy in prostate cancer. Cancer Res. 2007;67:10361–10367. doi: 10.1158/0008-5472.CAN-06-4758. [DOI] [PubMed] [Google Scholar]
Associated Data
This section collects any data citations, data availability statements, or supplementary materials included in this article.


