Figure 5.
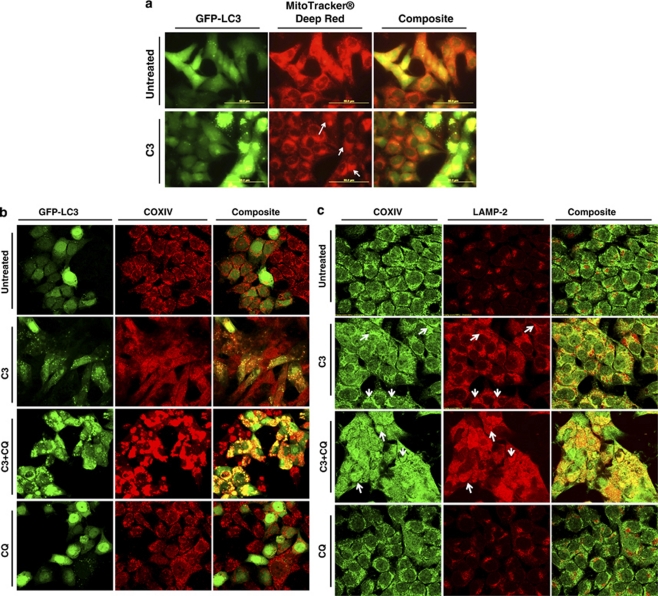
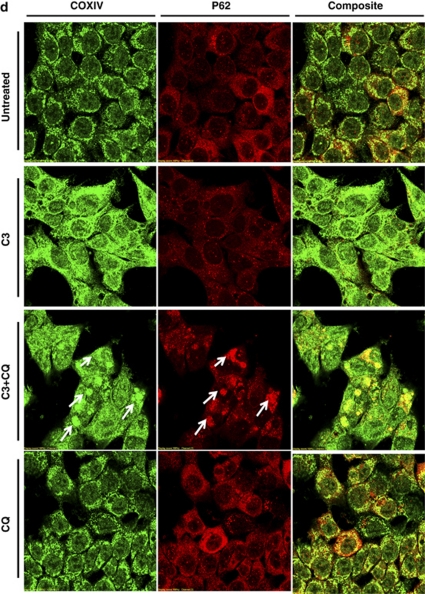
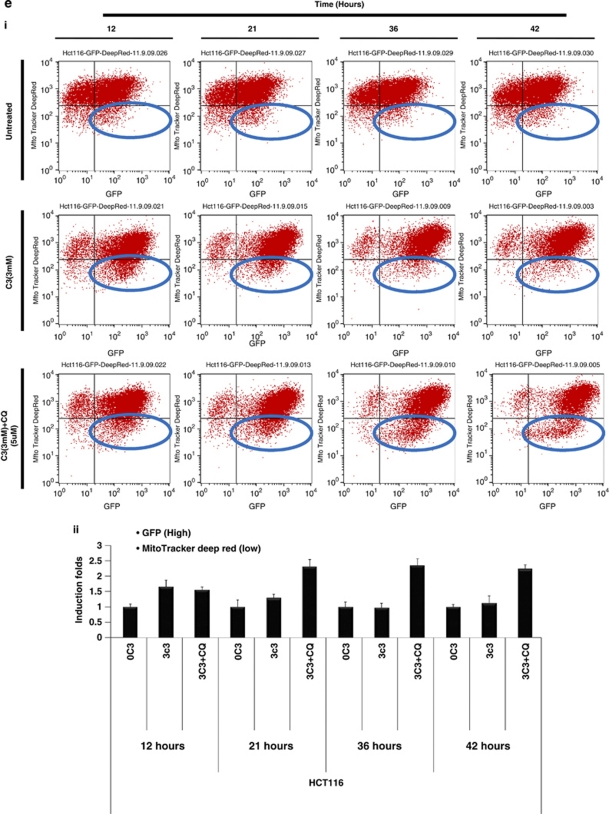
Defective mitochondria are targeted for autophagic degradation. (a) HCT116 cells with stable GFP-LC3 expression were treated with propionate (3 mM) or vehicle control (PBS) for 24 h. Mitochondria were stained by MitoTracker Deep Red, and representative images were obtained by fluorescence microscopy. Magnification, × 600. Arrows indicate the cells with autophagy induction by propionate. Note the smeared mitochondria staining in the cells with autophagy activation, which is reflected by the formation of GFP-LC3 dots. Yellow in the merged image indicates colocalization of GFP-LC3 with mitochondria. The treated cells were also stained with COXIV antibody (b) for mitophagy detection with a confocal microscope. HCT116 cells were treated with propionate (3 mM) in the presence or absence of CQ (5 μM) for 48 h. The cells were stained with COXIV/LAMP2 (c) or COXIV/p62 (d) antibodies. Representative images were obtained with an Olympus Fluoview confocal microscope using a × 60 oil immersion objective lens. HCT116 cells with stable GFP-LC3 expression were treated with propionate (3 mM) in the presence or absence of CQ (5 μM) for the indicated times. The GFP-LC3 and MitoTracker Deep Red fluorescence were analyzed by flow cytometry (ei) and the proportion of cells with increased GFP fluorescence and reduced MitoTracker Deep Red staining was presented as bar graph (eii). The bars represent the mean±S.E. (n=4). Arrows indicate the cells with autophagy induction by propionate


