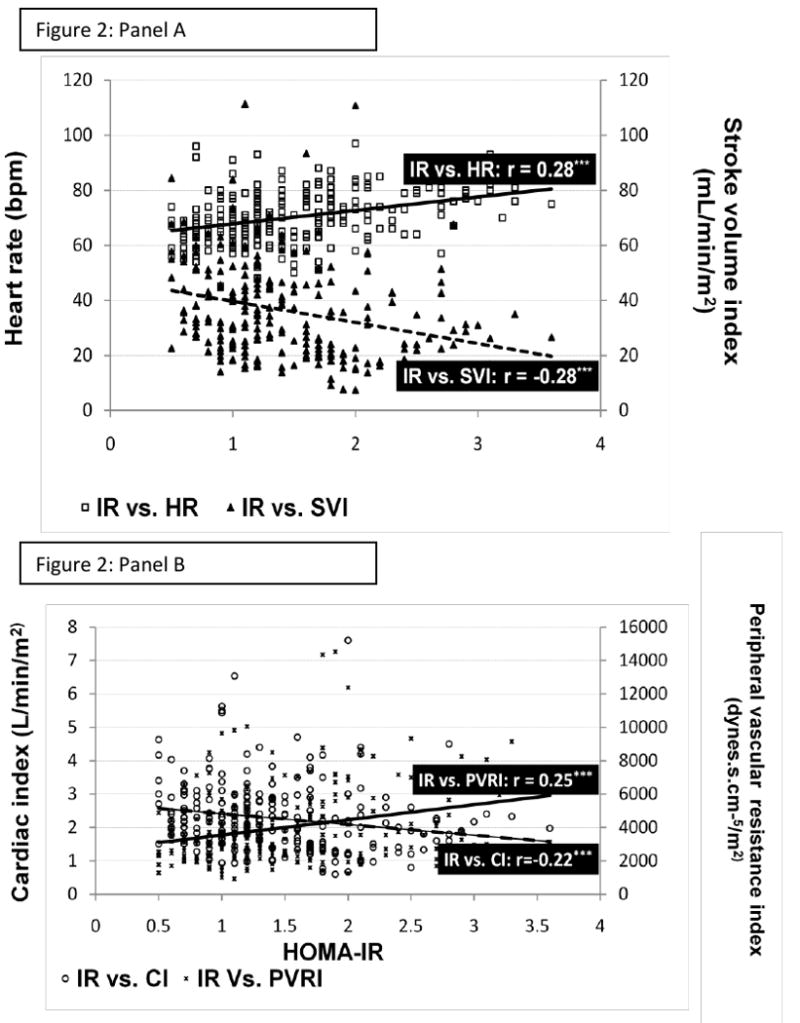
Figure 1. Scatter plot depicting the relationship between insulin resistance and hemodynamic variables.

Panel A depicts the positive correlation between insulin resistance (HOMA-IR) and heart rate (HR) and the negative relationship between HOMA-IR and stroke volume index (SVI).
Panel B depicts the positive correlation between HOMA-IR and peripheral vascular resistance index (PVRI) and the negative relationship between HOMA-IR and cardiac index (CI).
P-value * ≤0.05 ** ≤0.01 ***≤0.001
