Fig. 2.
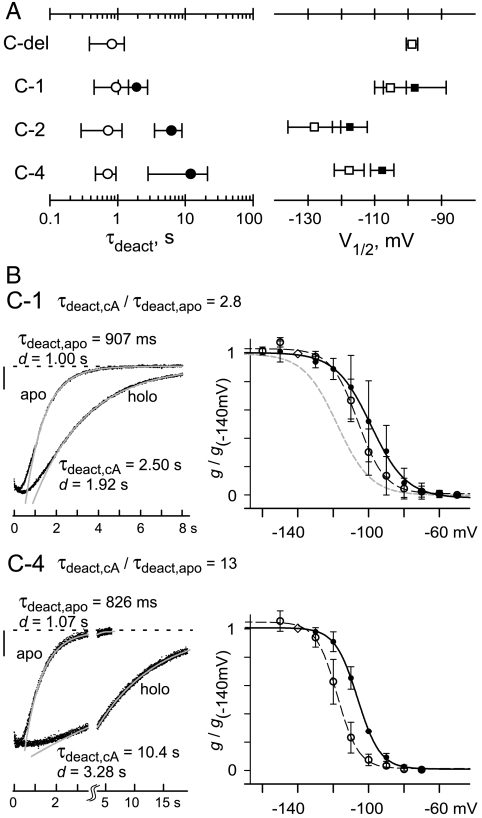
Open-state trapping in holo channels is sensitive to changes in CSD sequence. (A) Points plot mean ± SD (n = 3 to 16 for each point) of τdeact and V1/2 for homomeric channels in apo (open) or holo form (solid); detailed values and conditions are given in Table S1. (B) Deactivation tail currents (Left) and summary g-V relations (Right) for C-1 (Top) and C-4 (Bottom). Tail currents were measured as in Fig. 1D at -40 mV after activation for 3 s at -140 mV (C-1) or 5 s at -130 mV (C-4). Vertical scale bar: 20 pA; long time scale after axis break accommodates slow deactivation of C-4. The g-V relations were collected and normalized as in Fig. 1C; for C-4, conductances were measured after 5-s activation pulses. Apo: open points (data) and black dashed curves (fits); holo: solid points (data) and black solid curves (fits). Boltzmann parameters (± SEM, in mV): apo C-1, V1/2 = -106.1 ± 0.6, s = 7.7 ± 0.6; holo C-1, V1/2 = -98.7 ± 0.7, s = 10.0 ± 0.6; apo C-4, V1/2 = -117.7 ± 0.3, s = 6.0 ± 0.3; holo C-4, V1/2 = -106.3 ± 0.2, s = 6.4 ± 0.2. Gray dashed curve in the C-1 g-V graph (Top) shows g-V relation for apo C-2 from Fig. 1C.

