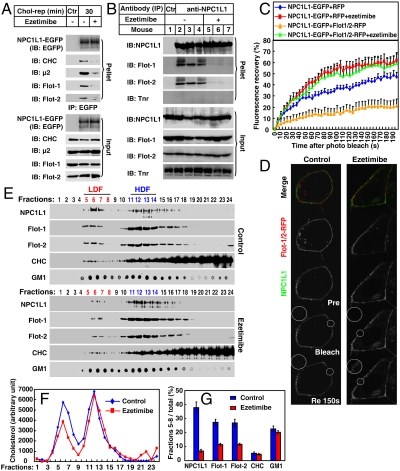
Fig. 5.
Ezetimibe inhibits the formation of cholesterol-enriched membrane microdomains by dissociating the association between NPC1L1 and flotillins. (A) Ezetimibe dissociates the association between NPC1L1 and flotillins in cultured cells. Cholesterol-depleted CRL1601–NPC1L1-EGFP cells were incubated without or with ezetimibe and replenished with cholesterol for 30 min. IP was performed with anti-EGFP coupled agarose. Immunoblot (IB) was carried out with indicated antibodies. Ctr, control; μ2, AP2 complex subunit μ2; Flot, flotillin; Tnr, transferrin receptor; rep, replenishment. (B) Ezetimibe dissociates the NPC1L1–flotillins complex in mice intestine. Eight-week old C57/B6 male mice were gavaged with 10 mg/kg ezetimibe suspended in 0.5% methyl cellulose or methyl cellulose (control) per day for 3 d. In the fourth day, 2 h after gavage with ezetimibe, the mice were killed and the mucosa from small intestine was collected. Membrane fractions was purified and lysed in IP buffer containing 2% digitonin followed by high-speed centrifugation to discard debris. The supernatant was incubated with 5 μg immunopurified anti-NPC1L1 antibody for 1 h. Protein A agarose was then added and rotated for 4 h at 4 °C. The agarose was washed with IP buffer containing 0.5% digitonin five times and IB was performed. (C and D) FRAP analysis. CRL1601 cells were transfected with indicated plasmids. After transfection (48 h), the cells were treated without or with ezetimibe and depleted of cholesterol for 60 min. Then NPC1L1-EGFP from each sample was bleached in indicated area on the PM and the fluorescence recovery of NPC1L1-EGFP was monitored (D) and quantified (C). Error bars represent standard deviations (n≥20). (E–G) Ezetimibe impairs the formation of cholesterol-enriched membrane microdomains. Cholesterol-depleted CRL1601–NPC1L1-EGFP cells were treated without or with ezetimibe and replenished with cholesterol. Sucrose gradient ultracentrifugation was performed. Fractions were collected and subject to IB–dot blot (E) and cholesterol assay (F). The relative amount of proteins and GM1 in LDF was quantified (G). Error bars represent standard deviations of three experiments.

