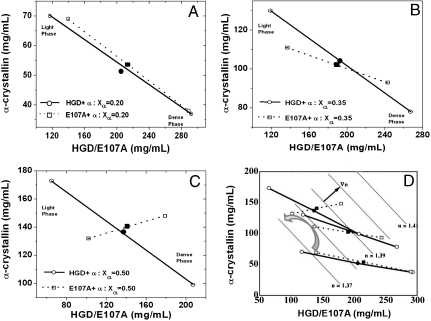
Fig. 4.
Tie lines for the coexistence curves showing the compositions of the two phases of mixtures of HGD–α or E107A–α: (A) at Xα = 0.20, (B) Xα = 0.35, and (C) Xα = 0.50, in 0.1 M phosphate buffer, pH 7.0, containing 20 mM DTT. In D all the tie lines are shown, along with the rotation of the tie lines for the E107A–α mixtures (curved arrow). The parallel dotted lines (in gray) are contours of constant refractive index, and the gradient of refractive index (∇n) is indicated by a small black arrow. Starting protein concentrations for each mixture is shown as a solid circle for HGD–α and a solid cube for E107A–α mixtures, respectively. The quench temperature for Xα = 0.2 and 0.5 mixtures were 0.5 °C while that for Xα = 0.35 was 0.8 °C.

