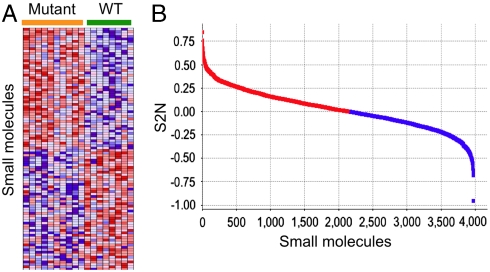
Fig. 3.
Identification of disease allele-dependent chemical sensitivities, using cells derived from individual patients. (A) Heatmap of small molecules that caused the most distinct effects on cellular ATP in mutant vs. wild-type LCLs; i.e., with the most positive and most negative S2N from the entire dataset of 3,973 screened small molecules. Each row represents a different small molecule, and each column is an individual patient-derived LCL sample; heatmap cells reflect the Z score of the ATP assay. (B) Distribution of S2N for all 3,973 screened compounds.

