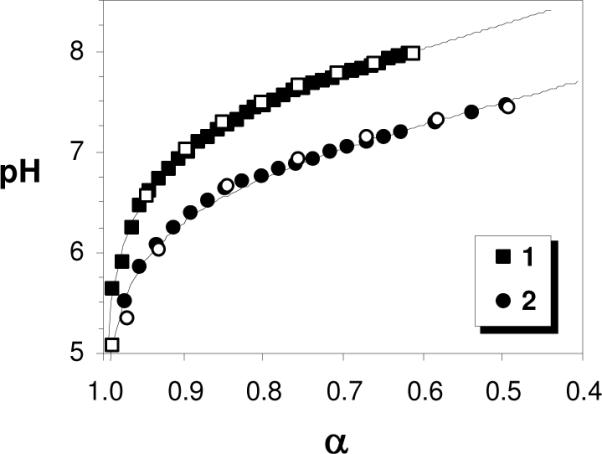
Figure 2.

Potentiometric titration curves for polymers 1 and 2. Filled symbols represent the forward titration with NaOH aq. and empty symbols denote the back-titration with HCl aq. in good agreement. The curves are best fits to the generalized Henderson-Hasselbalch equation for polyelectrolytes.
