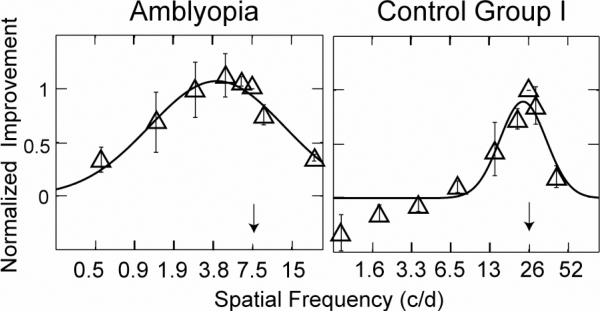
Figure 6.
Average contrast sensitivity improvements as functions of spatial frequency for the amblyopic (a) and first control groups (b). The magnitudes of contrast sensitivity improvements were normalized to that at the training spatial frequency; Spatial frequencies were normalized to the training frequency. Blue arrows indicate the average training spatial frequency. Data were weighted by their standard deviation. Only observers with significant contrast sensitivity improvements during training are included. Error bars indicate SEM. (After Huang et al, 2008).

