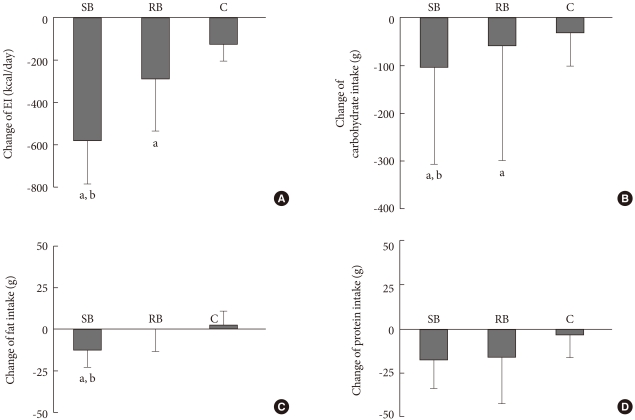
Fig. 1.
Change of EI (A), carbohydrate intake (B), fat intake (C) and protein intake (D) after 12-week's intervention in obese women with type 2 diabetes mellitus. The reduction in EI, carbohydrate, and fat intake in the SB group was more prominent than that in the C group (P < 0.05). The reduction of EI and carbohydrate intake in the SB group was greater than that in the RB group (P < 0.05). C, control; EI, energy intake; SB, small size rice bowl (200 mL bowl); RB, regular size rice bowl (380 mL bowl). aP values < 0.05 vs. C group, bP values < 0.05 vs. RB group.

