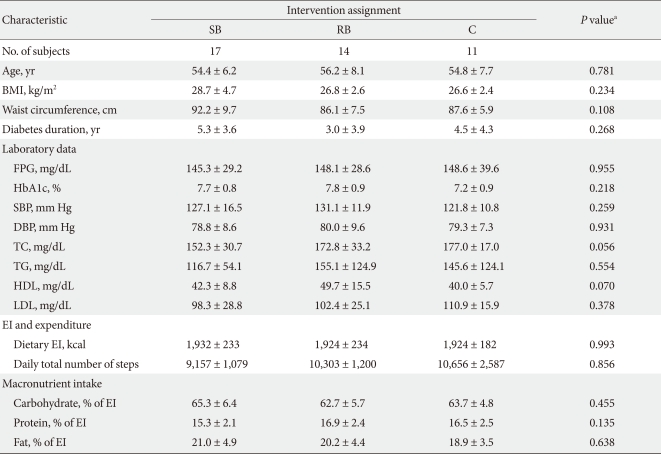
Table 1.
Baseline characteristics
Values are presented as mean ± standard deviation.
SB, small size rice bowl (200 mL bowl); RB, regular size rice bowl (380 mL bowl); C, control; BMI, body mass index; FPG, fasting plasma glucose; HbA1c, glycosylated hemoglobin; SBP, systolic blood pressure; DBP, diastolic blood pressure; TC, total cholesterol; TG, triglycerides; HDL, high density lipoprotein; LDL, low density lipoprotein; EI, energy intake.
aP values are for comparison among the groups by one-way ANOVA test.

