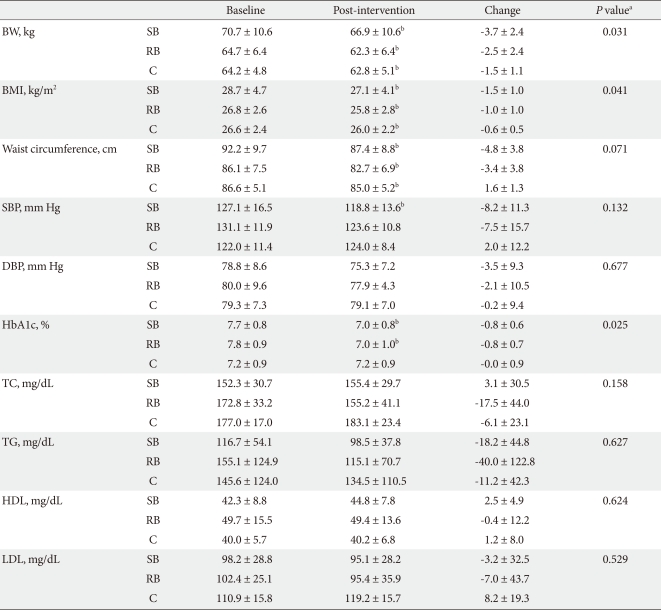
Table 3.
Change in body weight, blood glucose, and plasma lipids
Values were presented as mean ± standard deviation.
BW, body weight; SB, small size rice bowl (200 mL bowl); RB, regular size rice bowl (380 mL bowl); C, control; BMI, body mass index; SBP, systolic blood pressure; DBP, diastolic blood pressure; HbA1c, glycosylated hemoglobin; TC, total cholesterol; TG, triglycerides; HDL, high density lipoprotein; LDL, low density lipoprotein.
aP values are for comparison for changes from baseline to post-intervention among the groups by one-way ANOVA test, statistically significant in Tukey post-hoc analysis, bP values < 0.05 are for comparison between baseline and post-intervention within group by paired t-test.

