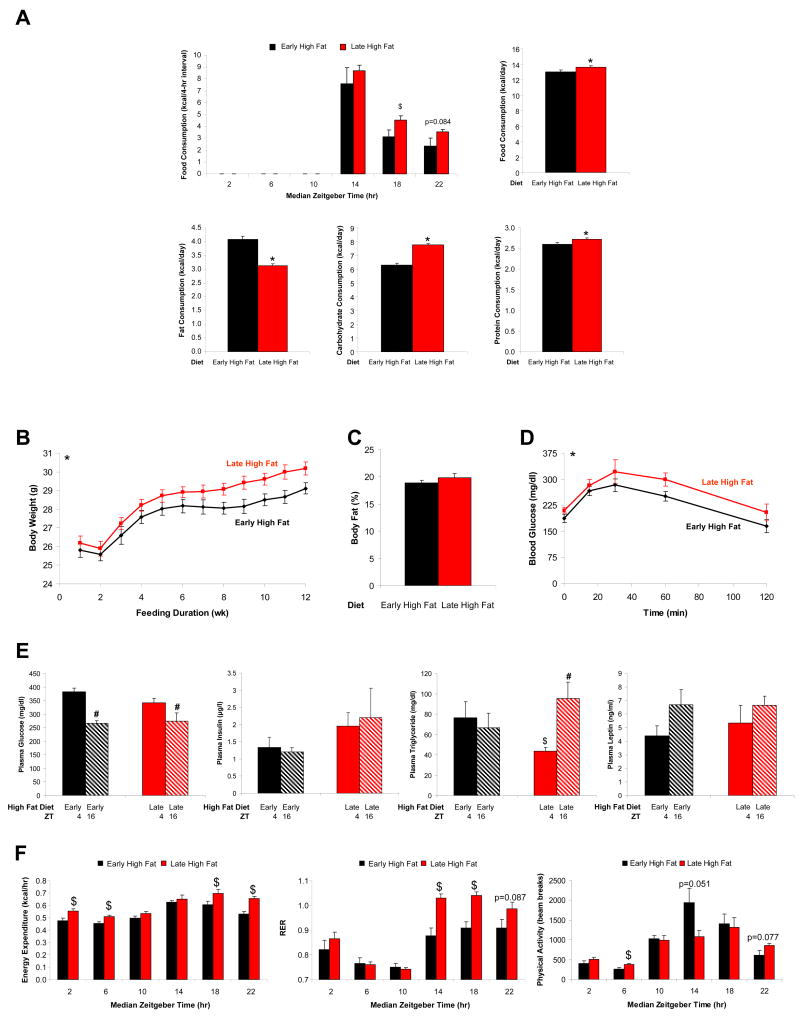
Figure 4.
Mice were divided into two distinct feeding groups, as depicted in Figure 1C. The effects of these feeding regimes on caloric intake (A), body weight (B), percent body fat (C), glucose tolerance (D), humoral factors (E), as well as energy expenditure, respiratory quotient, and physical activity (F) were determined. Data are shown as mean +/- SEM for 6-24 independent observations. * denotes p<0.05 main diet effect, $ denotes p<0.05 diet effect at a specific ZT, and # denotes p<0.05 time effect within a specific feeding group.

