
Figure 1. Method for measuring tissue contrast.
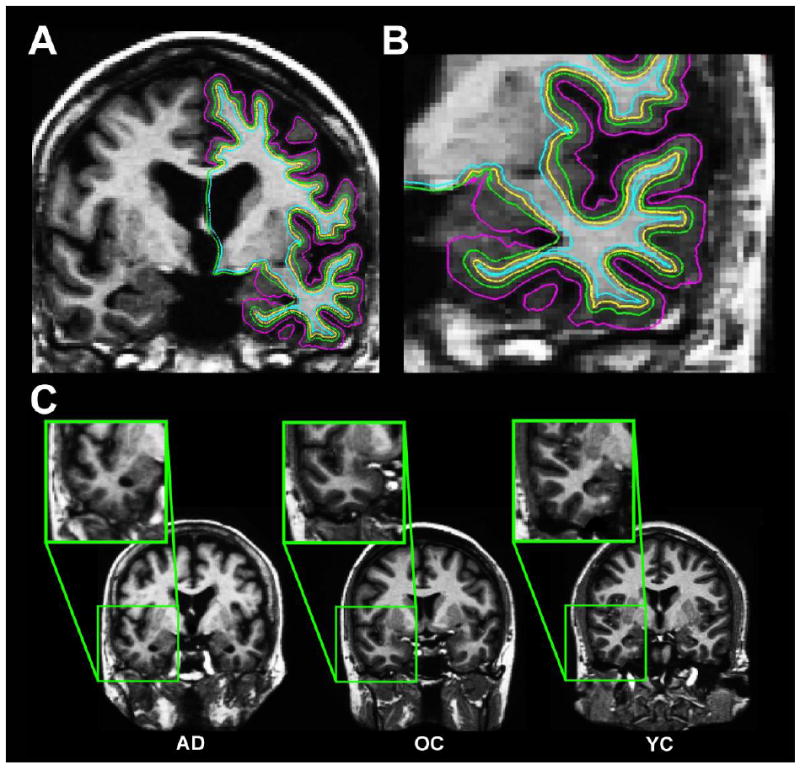
A-B. Gray matter tissue intensities (green surfaces; A, and in a magnified view in B, were measured at a depth of 35% through the thickness of the cortical ribbon, starting from the gray matter/white matter border (yellow surfaces) projecting towards the gray matter/cerebrospinal fluid border (purple surfaces), and 1mm subjacent to the gray/white border for white matter (blue surfaces). The 35% sampling procedure was utilized to be conservatively close to the gray/white border and the white matter sampling voxel (in order to minimize potential spurious effects that could arise in sampling from more remote locations and from sampling in regions of low cortical thickness). C. Demonstration of the differential regional gray matter/white matter tissue contrast in an individual with Alzheimer’s disease (AD), an older adult (OA), and a younger adult (YA).