
Figure 2. A. Effect of AD on gray and white matter signal normalized to mean cortical gray matter signal intensity.
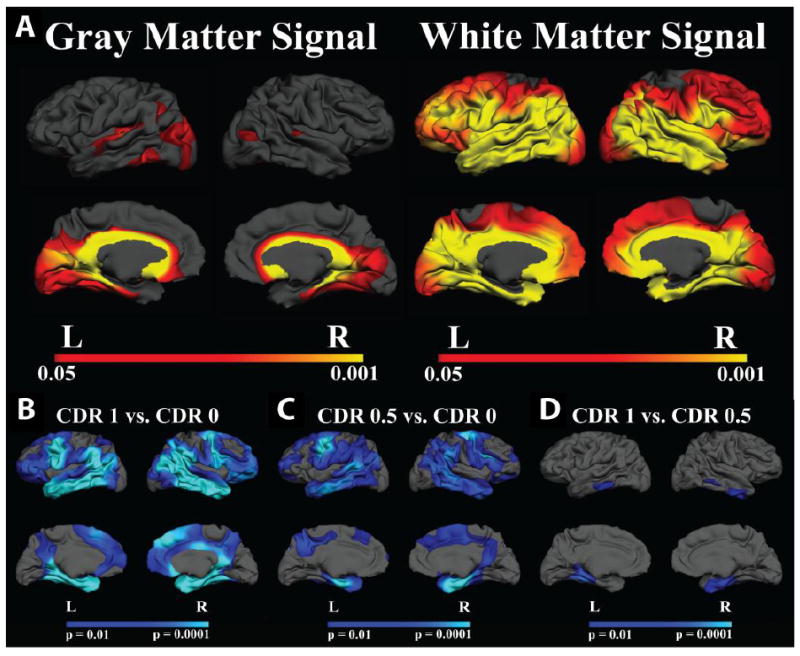
AD showed limited regional effects in gray matter signal (left panel), however, white matter intensity was decreased in AD throughout a large portion of the cerebral mantle. B-D. Group comparisons of GWR in Demented and Non-Demented Individuals. There was a significant effect on GWR in individuals with AD. CDR 1 and CDR 0.5 showed similar patterns of regionally distinct increases in GWR (contrast decreased) compared to nondemented controls (B-C). There were minimal effects on the GWR with increasing dementia severity. CDR 0.5 compared to CDR 1 showed significant changes in inferior lateral and medial temporal regions demonstrating modest progressive changes in the GWR with increasing dementia severity (D). Maps of the effect of AD on GWR were thresholded at p < 0.01.