
Figure 7. Gyral versus sulcal effects on GWR.
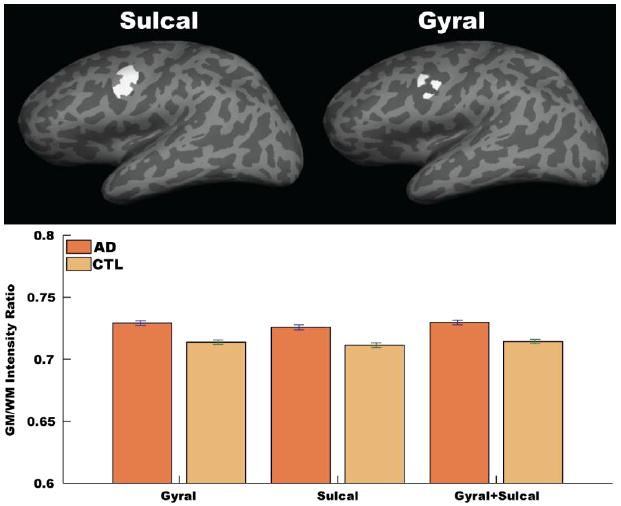
Unsmoothed GWR data were examined from two ROIs; one ROI limited to the sulcal portion of a region affected by AD (top left surface label, dark gray areas), and the other ROI limited to the gyral portion of the same region (top right surface label, light gray areas). The effects were similar across the two ROIs, and the results in each sub-ROI were similar to the full region.