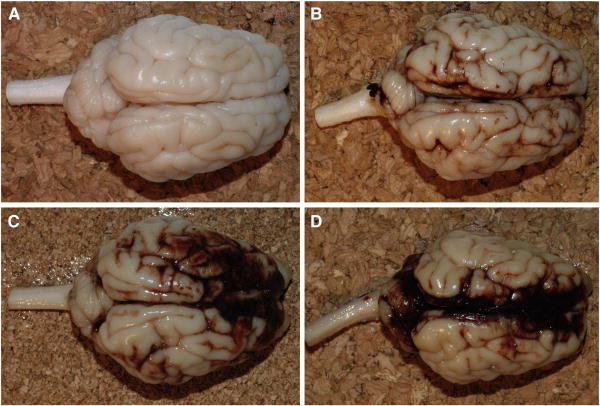
Figure 4.
Representative images demonstrating the range of subarachnoid hemorrhage (SAH) scores based on macroscopic and microscopic observations: (A) absent, (B) mild, focal and patchy, (C) moderate, solitary thick plaque obscuring brain, e.g. basal SAH, or multifocal patchy SAH over both hemispheres, and (D) severe extensive and obscuring.

