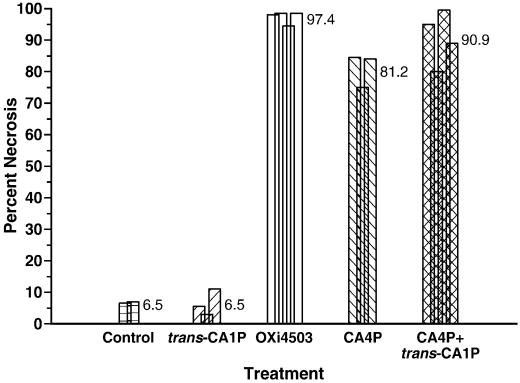
Fig. 8.
Percent tumor necrosis. KHT sarcoma-bearing mice were kept as controls or treated as described in Fig. 7. Twenty-four h post-drug exposure, tissue sections were prepared and percent necrosis assessed by image analysis (Methods section). Data represent individual tumors; for each tumor 3-4 sections were evaluated.

